
Graphing Linear Equations Practice
Loading the math board and drawing, please wait…
In collections
Geom. & Alg.: Systems Equations & Linear Programming
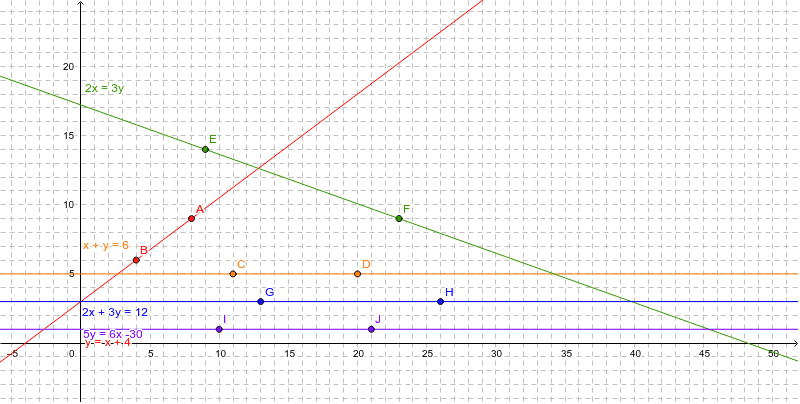
This example demonstrates graphing linear equations by plotting two points. Core math concepts include linear equations and coordinate geometry. Construction highlights involve using GeoGebra commands like Line and objects such as a, b, c, d, e, A, B, C, D, E, F, G, H, I, J, f, g, h, i, j, text1, text2, text3, text4, text5. Suitable for middle school and above students practicing coordinate geometry and linear function graphing.
GeoGebra Commands & Parameters
Line(A, B) → fLine(C, D) → gLine(E, F) → hLine(G, H) → iLine(I, J) → j
AI Drawing Prompt Reference
Draw two lines, each connecting a pair of distinct points, to illustrate the graphs of linear equations. Plot the first line through one pair of points, then the second line through another pair, and finally the third line through the last pair, using different colors for each line to distinguish them clearly.
The prompt above was compiled from the original drawing commands and is for reference only.