
Graphing Linear Equations in Slope-Intercept Form by bzmichelle525
Loading the math board and drawing, please wait…
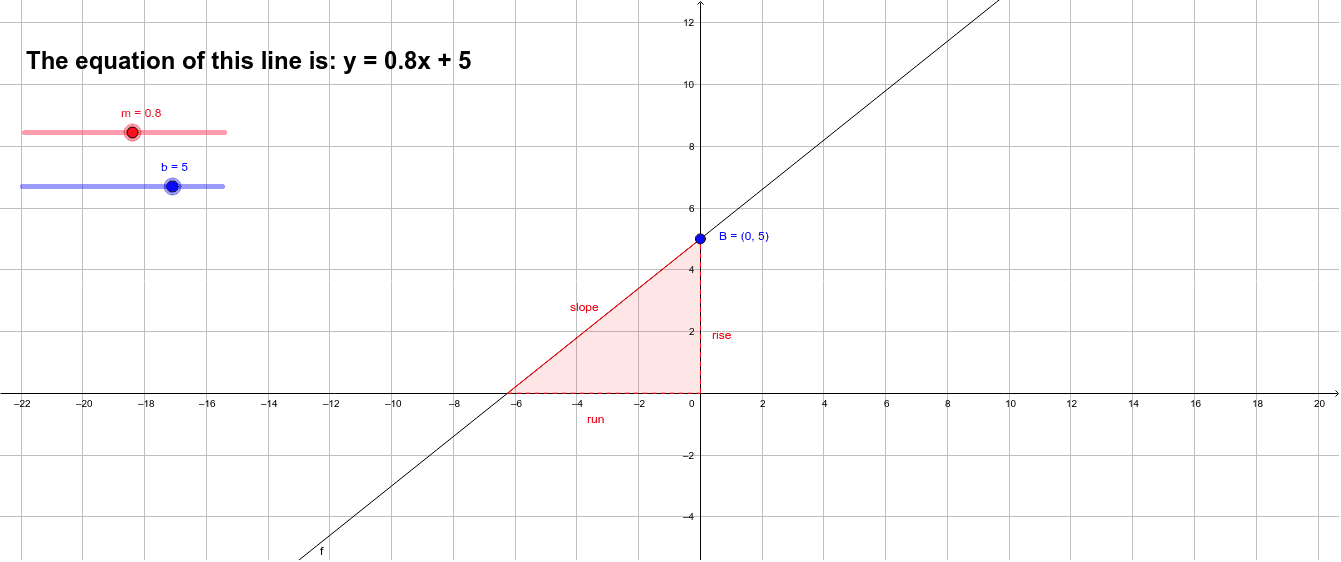
① This example demonstrates how to graph a linear equation in slope‑intercept form (y = mx + b) on the coordinate plane. ② Core concepts: linear functions, slope, y‑intercept, and the graphical properties of linear equations. ③ Construction highlights: GeoGebra commands Intersect (to find intersections) and Polygon (to build polygons); key objects include the line f, parameters b and m, points A, B, C, polygon poly1, and auxiliary objects run, rise, slope, text1. ④ Suitable for middle‑school (grade 8) through early high‑school algebra lessons, as well as self‑study or classroom presentation.
GeoGebra Commands & Parameters
Intersect(f, yAxis) → BIntersect(f, xAxis) → AIntersect(xAxis, yAxis) → CPolygon(A, C, B) → poly1, run, rise, slope