
Graphing Linear Equations in Algebra I
Loading the math board and drawing, please wait…
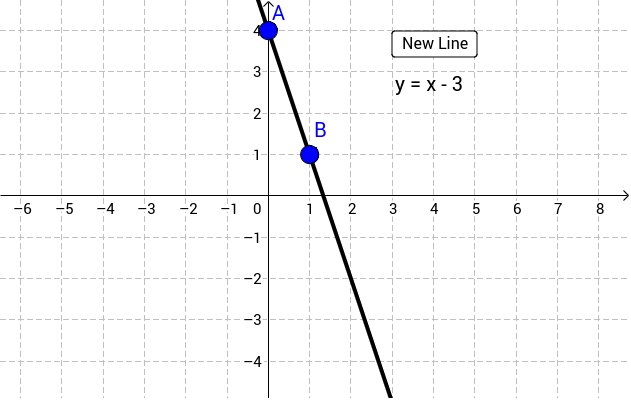
This example demonstrates how to plot linear equations on a coordinate plane, highlighting the relationship between lines and axes. Key mathematical concepts include linear equations, coordinate systems, and line equations. Construction involves using the GeoGebra Line command, defining points A and B, and setting parameter b. Suitable for middle school students learning Algebra I, useful for classroom demonstrations or self-study.
GeoGebra Commands & Parameters
Line(A, B) → b
AI Drawing Prompt Reference
Draw a line passing through point A and point B. Point A is located at (-2, 3) and point B is at (4, -1). First, define the positions of points A and B, then use the line tool to connect these two points, forming a straight line. This line represents the graph of a linear function, showing the relationship between points on the coordinate axes and the line.
The prompt above was compiled from the original drawing commands and is for reference only.