
Graphing Linear Equations in 2 Variables
Loading the math board and drawing, please wait…
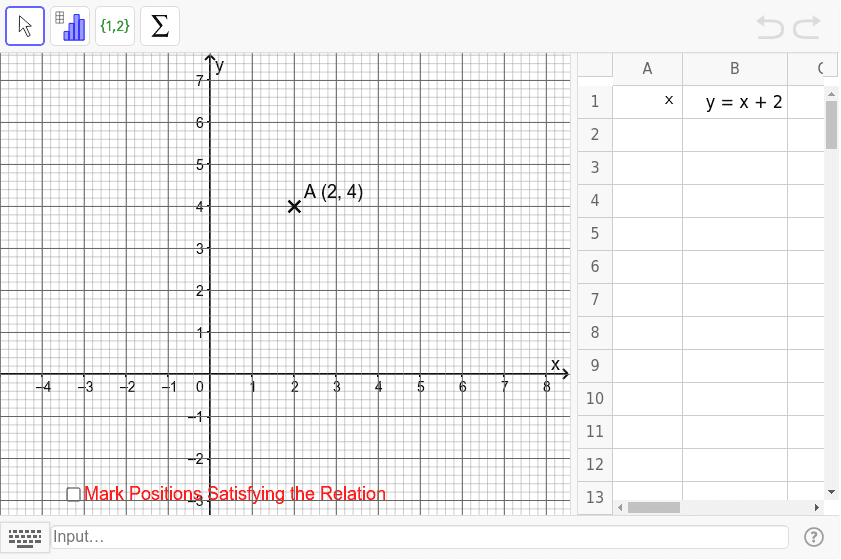
This example visually demonstrates that the set of points satisfying a linear equation forms a straight line in the rectangular coordinate plane. Key math concepts include linear equations in two variables, rectangular coordinate system, and linear relationships. The construction utilizes GeoGebra commands like Sequence, Distance, and Intersect, along with objects such as S, T, U, V, int, lists1-4, A, text1, B1, a, A1, b, c, A', and text3. It is suitable for middle school and above students to understand the geometric meaning and graphing of linear equations.
GeoGebra Commands & Parameters
Sequence(Segment[(x(S) + int * i, y(S)), (x(T) + int * i, y(T))], i, 0, (x(U) - x(T)) / int) → list1Sequence(Segment[(x(T), y(T) + int * i), (x(U), y(U) + int * i)], i, 0, (y(S) - y(T)) / int) → list2Sequence(Segment[(x(S) + int * i / 5, y(S)), (x(T) + int * i / 5, y(T))], i, 0, 5 * (x(U) - x(T)) / int) → list3Sequence(Segment[(x(T), y(T) + int * i / 5), (x(U), y(U) + int * i / 5)], i, 0, 5 * (y(S) - y(T)) / int) → list4Distance(A, B1) → aIntersect(B1, c) → A'