
Graphing Inequalities Exploration
Loading the math board and drawing, please wait…
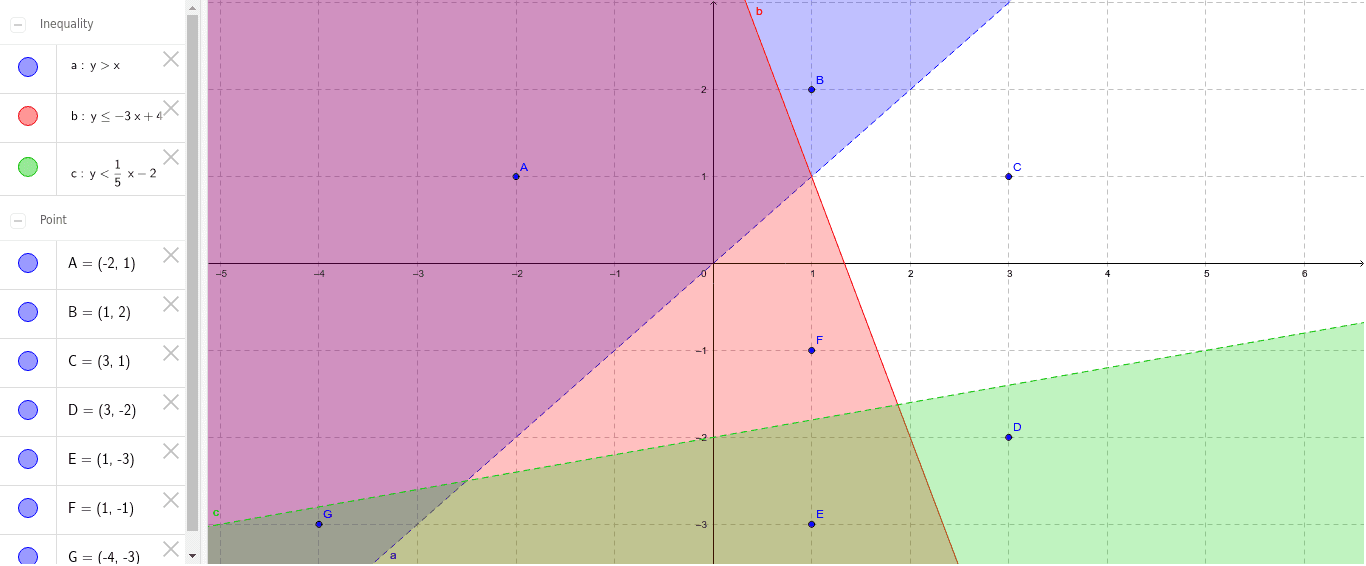
This example demonstrates the graphical representation of three linear inequalities with labeled points in each region. Core math concepts include inequalities, linear equations, and region representation. GeoGebra commands/objects used: a, b, c, A, B, C, D, E, F, G, A1, A2, A3, A4, A5, A6, A7, B1, B2, B3, B4, B5, B6, B7, C1, C2, C3, C4, C5, C6, C7, D1, D2, D3, D4, D5, D6, D7, E1, E2. Suitable for high school students to understand the geometric representation of inequality solutions and region division.
GeoGebra Commands & Parameters
a(x, y) = y > xb(x, y) = y ≤ (-3 * x) + 4c(x, y) = y < (1 / 5 * x) - 2Point A(-2.0, 1.0)Point B(1.0, 2.0)Point C(3.0, 1.0)Point D(3.0, -2.0)Point E(1.0, -3.0)Point F(1.0, -1.0)Point G(-4.0, -3.0)x(A)x(B)x(C)x(D)x(E)x(F)x(G)y(A)y(B)y(C)y(D)y(E)y(F)y(G)a(A)a(B)a(C)a(D)a(E)a(F)a(G)b(A)b(B)b(C)b(D)b(E)b(F)b(G)c(A)c(B)c(C)c(D)c(E)c(F)c(G)
AI Drawing Prompt Reference
Graph three linear inequalities using different colored shaded regions, marking key points labeled A to G in each area. Start by drawing three lines for the inequalities y > x, y ≤ -3x + 4, and y < (1/5)x - 2, shading the regions that satisfy each inequality. Place seven points labeled A to G in each shaded area, ensuring their positions clearly show the division of regions and the geometric representation of the solution sets.
The prompt above was compiled from the original drawing commands and is for reference only.