
Graphing Inequalities by Kutasi László
Loading the math board and drawing, please wait…
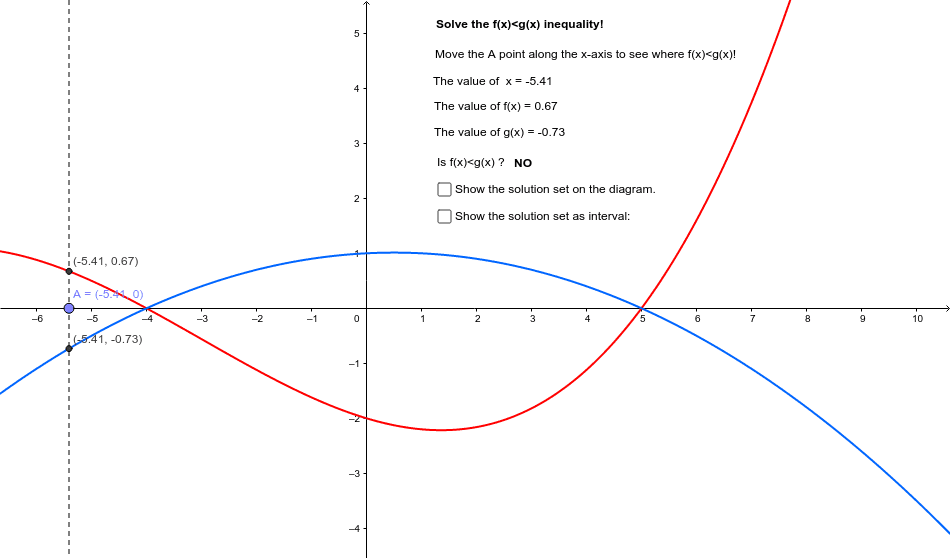
This example demonstrates how to graph inequalities and visualize their solution sets in GeoGebra. Key math concepts include inequalities, function graphs, and region representation. Construction highlights involve commands/objects like Point, OrthogonalLine, and Intersect. Suitable for high school students learning about the geometric meaning of inequality solution sets and for teaching demonstrations.
GeoGebra Commands & Parameters
Point(xAxis) → AOrthogonalLine(A, xAxis) → aIntersect(f, a) → BIntersect(g, a) → C
AI Drawing Prompt Reference
Draw an x-axis, then take a point A on the x-axis and draw a line a perpendicular to the x-axis through point A. Find the intersection points B and C of line a with functions f and g, respectively. Finally, shade the region enclosed by points A, B, and C to represent the solution set of the inequality.
The prompt above was compiled from the original drawing commands and is for reference only.