
Graphing Inequalities and Interval Notation
Loading the math board and drawing, please wait…
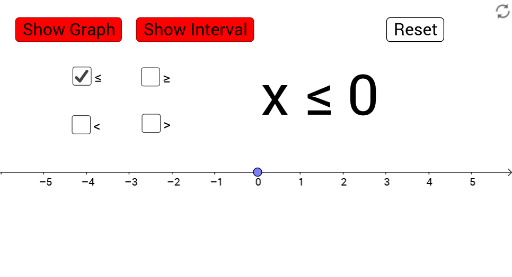
This example demonstrates how to graph inequalities in a coordinate system and display their corresponding interval notation. Key math concepts include inequalities, interval notation, and coordinate geometry. It utilizes GeoGebra commands like Point, Vector, and objects such as e, C, A, a, b, c, B, d, f, text2, text3, text5, button1, button2, showgraph, showinterval, button3, button4, text4, shade, button5, text1 for construction. Suitable for high school and university preparatory mathematics education, helping students understand the relationship between inequality graphs and interval notation.
GeoGebra Commands & Parameters
Point(xAxis) → CVector(A, B) → shade
AI Drawing Prompt Reference
Graph inequalities in a coordinate system and display their corresponding interval notation. Mark a point on the x-axis and fill the region between two points with a vector to represent the solution set of the inequality.
The prompt above was compiled from the original drawing commands and is for reference only.