
Finding the Equation of a Line from a Graph
Loading the math board and drawing, please wait…
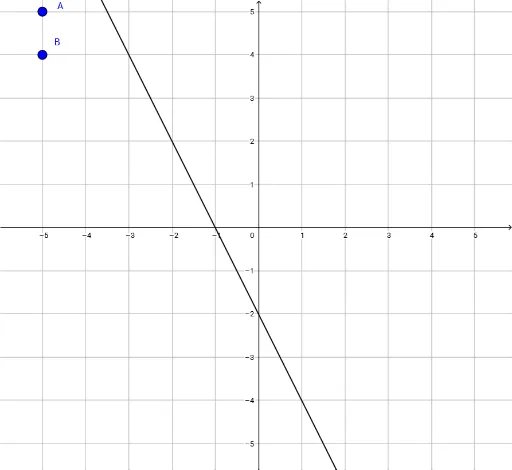
This interactive GeoGebra example demonstrates how to determine the equation of a straight line (y = mx + b) from its graph. It guides users through a phased practice: first identify the y-intercept, then compute the slope using two points on the line, and finally assemble the equation. Core mathematical concepts include linear functions, slope, y-intercept, and the coordinate geometry of lines. The construction uses GeoGebra commands such as If, Random, Point, Vector, Textfield, and FractionText to generate random lines and dynamic feedback. Key objects include points A, B, C, E, F, lines g, h, i, and variables mySlope, myIntercept. Buttons (buttonPhase1-4) control the progression, while InputBox1 and InputBox2 allow user input, with incorrectFlag1-3 providing error checking. This resource is ideal for middle or high school students learning linear equations, and for teachers demonstrating step-by-step problem solving in class.
GeoGebra Commands & Parameters
If(x(B) ≤ x(A), x = x(B), x = x(A)) → gRandom(-6, 6) → x_1Random(-6, 6) → x_2Random(-5, 5) → y_1Random(-5, 5) → y_2Random(-5, 5) → myInterceptPoint(g) → CVector(If[x(B) ≤ x(A), B, A], C) → uIf(x(B) ≤ x(A), y = y(A), y = y(B)) → hPoint(h) → FVector(C, F) → vIf(x(B) ≤ x(A), y = y(A), y = y(B)) → iIf(x(B) ≤ x(A), x = x(A), x = x(B)) → jTextfield(verticalChange) → InputBox1Textfield(horizontalChange) → InputBox2Textfield(slopeCheck) → InputBox3FractionText(mySlope) → myFracSlopeTextfield(yInt) → InputBox4Point({0, f(0)}) → pointYIntTextfield(guessEq) → InputBox5
AI Drawing Prompt Reference
Create an interactive illustration showing how to find the equation of a line from its graph. Generate a random straight line, mark the y-intercept point, then select two points to calculate the slope, and display dynamic text boxes for user input of changes and guessed equations. Include lines, points, and text boxes, demonstrating the process of identifying the y-intercept, calculating slope, and assembling the equation step by step.
The prompt above was compiled from the original drawing commands and is for reference only.