
Graphing Hyperbola by sambethr03 (2)
Loading the math board and drawing, please wait…
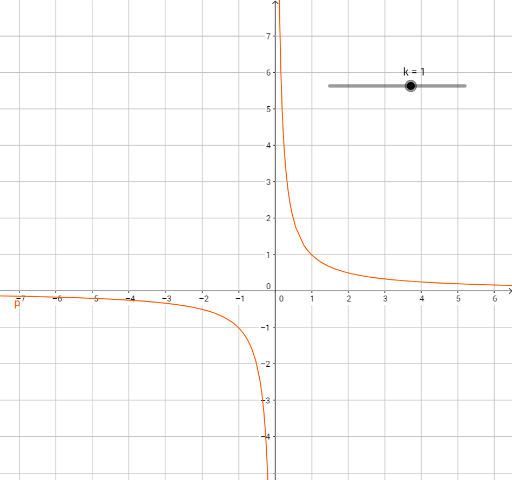
This example demonstrates how to graph a hyperbola using GeoGebra. It involves key mathematical concepts such as the definition and properties of hyperbolas. By adjusting parameters k, p, q, and r, you can observe changes in the hyperbola. Construction highlights include using GeoGebra commands to define the hyperbola's equation and plot its graph. Suitable for high school math education and learning.
GeoGebra Commands & Parameters
Numeric k(1)p(x) = k / xq(x) = 1 / x + kr(x) = 1 / (x + k)
AI Drawing Prompt Reference
Draw a hyperbola by adjusting parameter k to observe its variations. First plot the function y=k/x, then plot y=1/x+k, and finally plot y=1/(x+k) to see how the graphs change with k, demonstrating the basic shape and properties of the hyperbola.
The prompt above was compiled from the original drawing commands and is for reference only.