
Graphing Straight Lines: Exploring Slope and Intercept
Loading the math board and drawing, please wait…
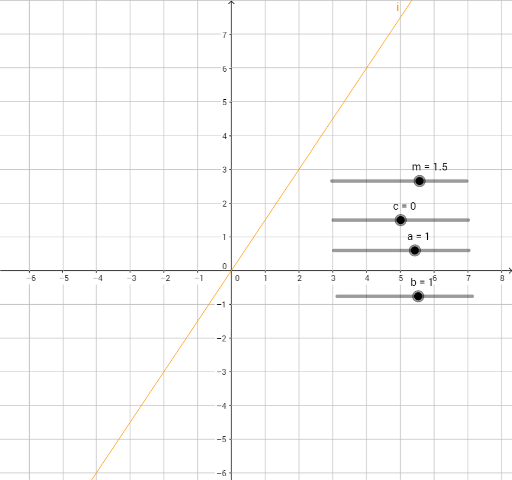
① This example demonstrates how to graph the straight line y = mx + c by adjusting parameters m and c, allowing users to visually explore how changes in slope and intercept affect the line's position and orientation in the coordinate plane. ② Core mathematical concepts include linear functions, slope (m), y-intercept (c), and their geometric interpretations. ③ Construction details: Based on the summary, objects m, c, a, b, i, j are used; m and c likely serve as sliders or numeric parameters, a and b may be points on the line or auxiliary objects, and i and j could control the domain or line segment rendering, enabling dynamic updates of the graph. ④ Suitable for middle school to high school students learning linear functions and coordinate geometry, as well as for teachers demonstrating the relationship between algebraic parameters and graphical representation.
GeoGebra Commands & Parameters
Numeric m(1.5)Numeric c(0)Numeric a(1)Numeric b(1)y = (m * x) + c(a * x) + (b * y) + c = 0