
Graphing Exponential Functions Extended Problem #4
Loading the math board and drawing, please wait…
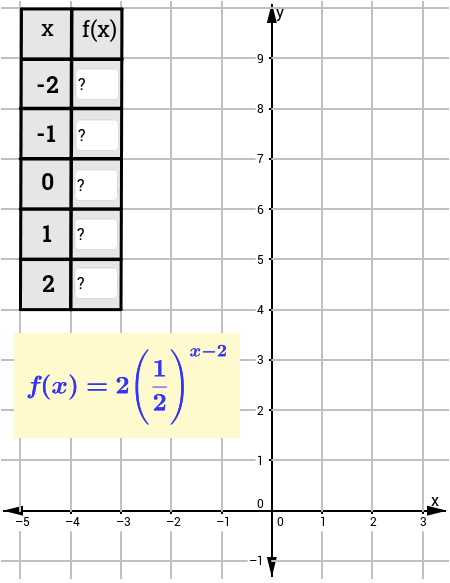
This example demonstrates the plotting of exponential function graphs and checks for understanding. It involves core math concepts like exponential function properties, graphing techniques, and fraction operations. Constructed using commands like Segment, Textfield, Polygon, Point in GeoGebra. Suitable for high school mathematics teaching, focusing on function graphing and concept comprehension.
GeoGebra Commands & Parameters
Segment(F, S) → aSegment(H, T) → bSegment(T, S) → cSegment(H, F) → dSegment(I, J) → eTextfield(l) → inputBox1Textfield(n) → inputBox3Textfield(p) → inputBox5Textfield(q) → inputBox6Textfield(r) → inputBox7Polygon(G, M, N, L) → poly1, g, m_1, n_1, l_1Segment(K, O) → hSegment(P, W) → iSegment(R, F_1) → kSegment(U, G_1) → sSegment(V, H_1) → tSegment(I_1, J_1) → a_1Segment(K_1, L_1) → b_1Point(g) → M_1Segment(N_1, E_1) → d_1Segment(Q, E_1) → j