
Graphing Exponential Functions by Thomas Gebbie (3)
Loading the math board and drawing, please wait…
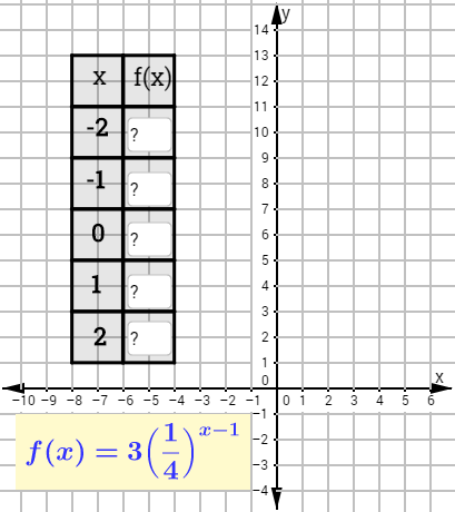
This example asks students to plot exponential functions to deepen their understanding of exponential functions. Key mathematical concepts include the properties and graph characteristics of exponential functions. It uses GeoGebra objects and commands such as points, line segments, polygons, and functions. Suitable for middle school and above students to learn about exponential functions.
GeoGebra Commands & Parameters
Segment(F, S) → aSegment(H, T) → bSegment(T, S) → cSegment(H, F) → dSegment(I, J) → eTextfield(l) → inputBox1Textfield(n) → inputBox3Textfield(p) → inputBox5Textfield(q) → inputBox6Textfield(r) → inputBox7Polygon(G, M, N, L) → poly1, g, m_1, n_1, l_1Segment(K, O) → hSegment(P, W) → iSegment(R, F_1) → kSegment(U, G_1) → sSegment(V, H_1) → tSegment(I_1, J_1) → a_1Segment(K_1, L_1) → b_1Point(g) → M_1Segment(N_1, E_1) → d_1Segment(Q, E_1) → j