
Graphing Exponential Functions by Lindsay Ross
Loading the math board and drawing, please wait…
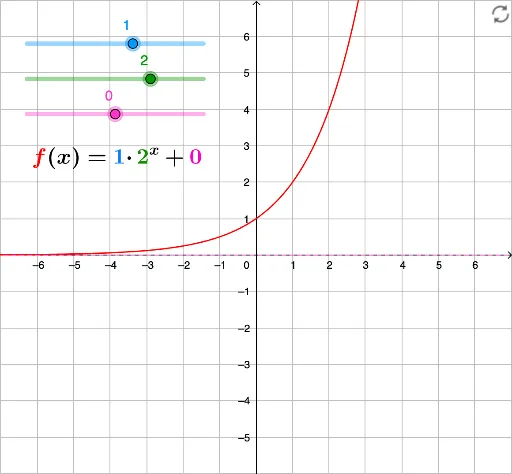
This example demonstrates how to graph exponential functions and visualize their behavior. Key math concepts include properties of exponential functions, median line, tree diagrams, definite integral, right triangles, and binomial distribution. GeoGebra commands and objects used are a (base), r (exponent), h (height), f (function), g (graph), and text1 (text label). Suitable for high school students and teachers for teaching and exploring the characteristics of exponential function graphs.
GeoGebra Commands & Parameters
Numeric a(1)Numeric r(2)Numeric h(0)f(x) = (a * r^(x)) + hy = h