
Graphing Derivative Functions: Tangent Slopes and Function Change
Loading the math board and drawing, please wait…
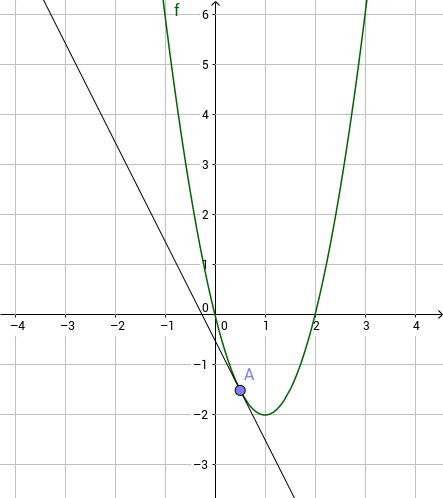
① This example dynamically demonstrates how the graph of a derivative function is generated by showing the tangent line at a moving point A on a function f, making the geometric meaning of the derivative as an instantaneous rate of change intuitive. ② Core mathematical concepts include derivatives, tangent slopes, the correspondence between a function and its derivative graph, and the auxiliary role of the median line in analysis. ③ Construction highlights: using GeoGebra's Point command to create a movable point A on the function f, and the Tangent command to generate the tangent line g at that point, thereby visualizing the changing slope and simultaneously plotting the derivative function. ④ Suitable for high school and early college students learning calculus, ideal for classroom demonstrations or self-exploration of derivative concepts, and useful for teachers creating interactive derivative teaching materials.
GeoGebra Commands & Parameters
Point(f) → ATangent(A, f) → g