
Graphing Complex Solutions
Loading the math board and drawing, please wait…
In collections
3D Geometry & Cross Sections
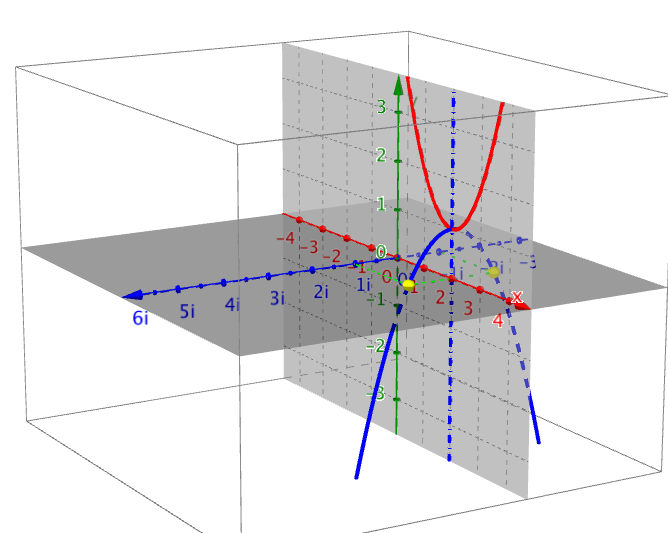
This example visualizes the complex roots of a quadratic equation as intersection points between a transformed parabola and the complex plane. It involves core math concepts like complex numbers, quadratic equations, complex planes, and parabolic transformations. The construction utilizes GeoGebra commands such as Intersect, Point, Plane, OrthogonalLine, OrthogonalPlane, IntersectPath, and Segment. Suitable for high school and above, it helps understand the geometric significance of complex roots and the interaction between function graphs and the complex plane.
GeoGebra Commands & Parameters
Intersect(f, a, 1) → APoint(f) → BPoint(f) → CPlane(C, A, B) → bOrthogonalLine(A, a, space) → dOrthogonalPlane(A, e) → gIntersectPath(g, c) → hIntersect(i, h) → D_1, DPoint(zAxis) → ESegment(E, D_1) → jPoint(zAxis) → FSegment(F, D) → kIntersect(a, xAxis) → GSegment(G, D_1) → lSegment(G, D) → m
AI Drawing Prompt Reference
Draw a parabola on the complex plane and show its intersection with the complex axis. Then, draw a line perpendicular to the complex axis through this intersection point, and use this line as a normal to draw a plane perpendicular to the complex plane. Project the parabola onto this plane to get a projected curve. Finally, find the intersections of this projected curve with the complex plane, and connect each intersection point to the complex origin with a line segment to visualize the geometric meaning of complex solutions.
The prompt above was compiled from the original drawing commands and is for reference only.