
Graphically Calculate Derivative
Loading the math board and drawing, please wait…
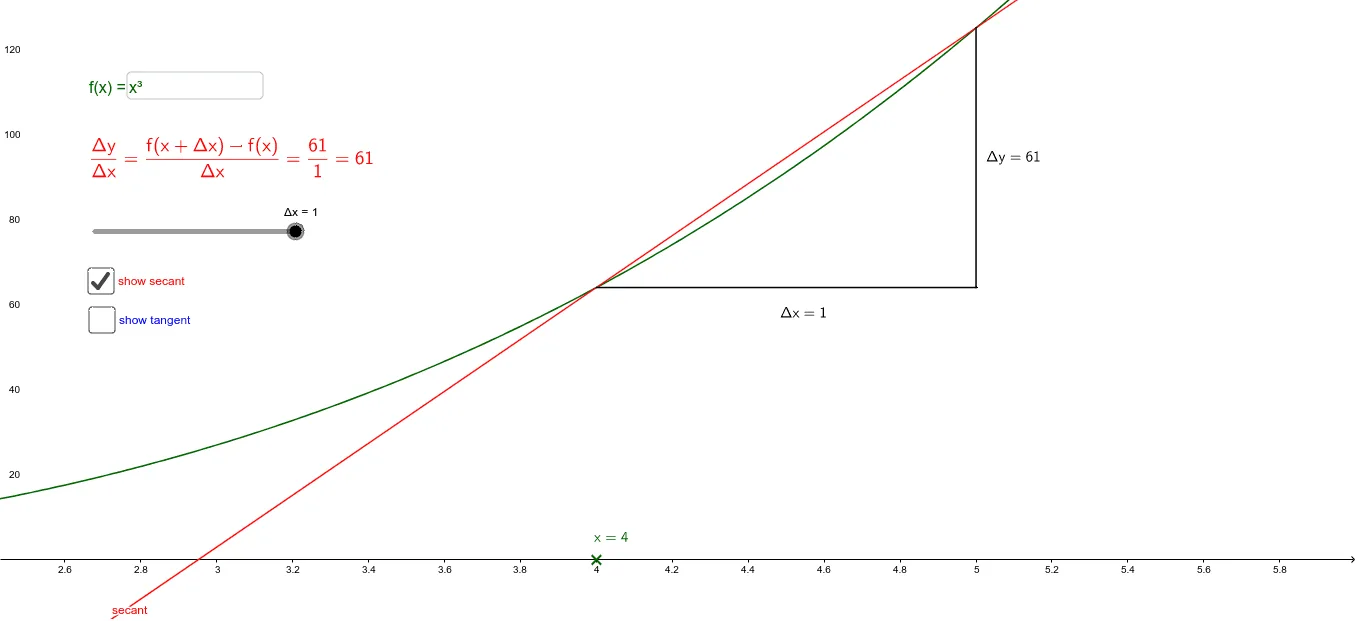
This example demonstrates how to calculate derivatives graphically. The key mathematical concept is the derivative, which represents the instantaneous rate of change of a function at a point. By constructing tangent and secant lines, the concept of a derivative is visually understood. GeoGebra commands used include Point, Line, Segment, Tangent, Midpoint, and Textfield. Suitable for high school mathematics education and learning derivative concepts.
GeoGebra Commands & Parameters
Point(xAxis) → X_0Line(P, Q) → secantSegment(P, R) → ΔxSegSegment(Q, R) → ΔySegTangent(P, f) → tangentMidpoint(ΔxSeg) → ΔxSeg'Midpoint(ΔySeg) → ΔySeg'Textfield(f) → InputBox1