
Graphical Solution of Simultaneous Equations
Loading the math board and drawing, please wait…
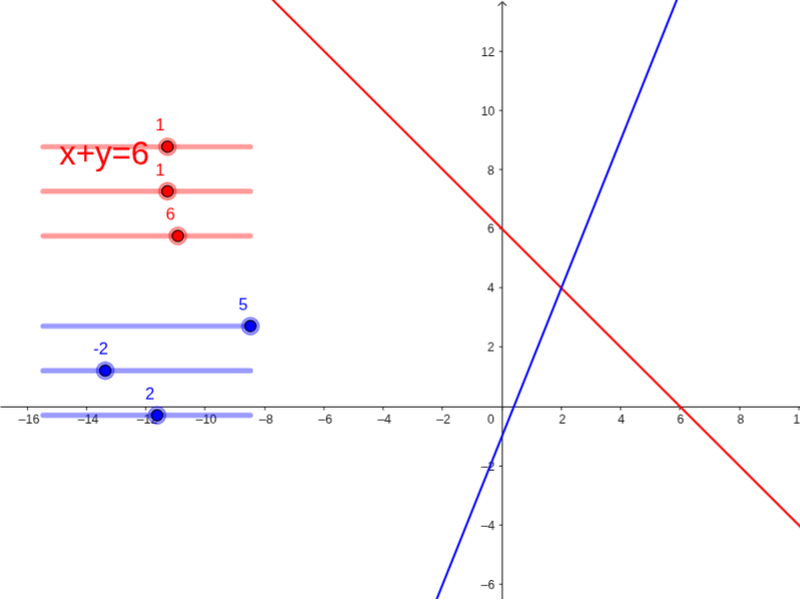
This example demonstrates how to solve simultaneous linear equations by finding their intersection points graphically. Key math concepts include systems of equations, straight lines, intersections, and coordinate geometry. It uses GeoGebra commands/objects like a, b, c, d, e, f, g, h, text1, text2 for parameter definitions and labels. Suitable for high school mathematics education to understand and master the graphical method for solving linear systems.
GeoGebra Commands & Parameters
Numeric a(1)Numeric b(1)Numeric c(6)(a * x) + (b * y) = cNumeric e(5)Numeric f(-2)Numeric g(2)(e * x) + (f * y) = g
AI Drawing Prompt Reference
Draw two straight lines, one passing through points (0,6) and (1,1), and the other through points (0,2) and (5,-2), and mark their intersection point, while displaying the equations of the lines and the coordinates of the intersection point to visually demonstrate how to solve a system of linear equations graphically.
The prompt above was compiled from the original drawing commands and is for reference only.