
Graphical Solution of Linear Equations in Two Variables
Loading the math board and drawing, please wait…
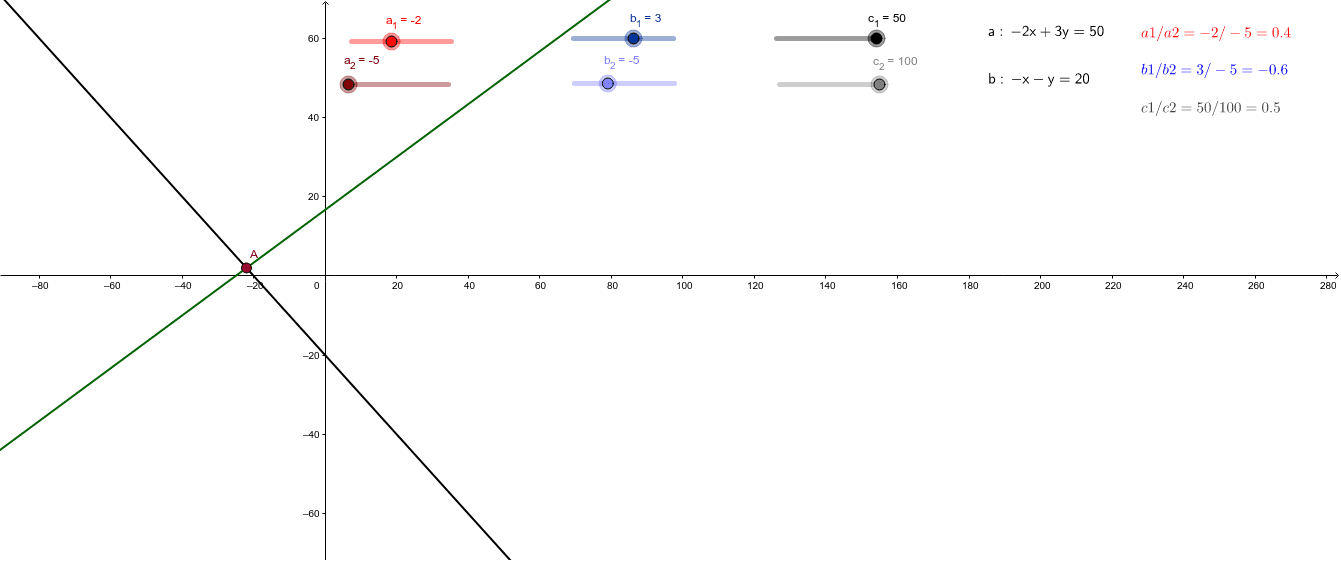
① This example demonstrates the graphical representation of a system of two linear equations in two variables, where the solution is the intersection point of the two straight lines. ② Core mathematical concepts include linear equations, straight-line graphs, systems of linear equations, and the relationship between algebraic solutions and geometric intersections. ③ Construction details: Based on the construction summary, LaTeX commands are used to display equation texts, the Intersect command finds the intersection point of the two lines, and objects such as a_1, b_1, c_1, a_2, b_2, c_2 define the coefficients, while text1, text2, text3 and related labels show the equations and the intersection coordinates. ④ Suitable for middle school and high school students learning linear systems and coordinate geometry, as well as for teachers to illustrate the connection between algebraic and graphical solutions in classroom demonstrations.
GeoGebra Commands & Parameters
LaTeX(a, true, true) → text1LaTeX(b, true, true) → text2Intersect(a, b) → A