
Graphical Polynomial Arithmetic: Visualizing Sum, Difference, Product, and Quoti
Loading the math board and drawing, please wait…
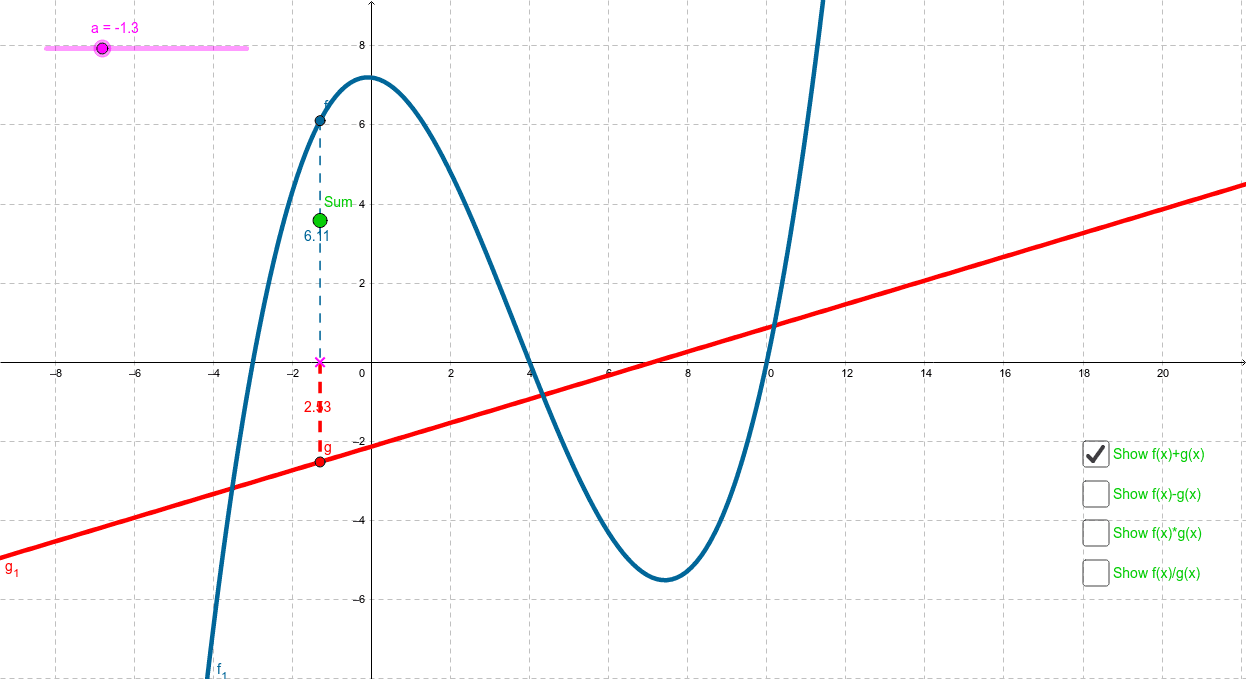
① This GeoGebra example demonstrates polynomial arithmetic (addition, subtraction, multiplication, and division) in a graphical way, allowing learners to see how algebraic operations correspond to geometric representations on the coordinate plane. ② Core mathematical concepts include polynomial functions, arithmetic operations on expressions, function graphs, and the relationship between algebraic formulas and geometric objects. ③ Construction details: The summary lists the Segment command and objects such as g_1, f_1, a, Sum, Difference, Product, Quotient, A, f, g, g_2, f_2, b, c, d, e, which likely represent polynomial functions and their operation results, built using segments and points to create visual diagrams. ④ Suitable for high school to pre-university students, this example supports interdisciplinary learning of algebra and geometry, and serves as an effective classroom demonstration tool for teachers to illustrate polynomial operation rules intuitively.
GeoGebra Commands & Parameters
Segment(A, g) → g_2Segment(f, A) → f_2
AI Drawing Prompt Reference
Draw two polynomial function graphs on a coordinate plane and visualize their sum, difference, product, and quotient geometrically. Use line segments to connect points on the function graphs, forming a visual diagram that illustrates the relationship between algebraic operations and geometric shapes. Start by plotting the basic graphs of the two functions, then connect key points with line segments to construct the visual representations of the sum, difference, product, and quotient, and finally present the complete geometric construction process.
The prompt above was compiled from the original drawing commands and is for reference only.