
Matching Quadratic Functions: Exploring Similarity and Function Graphs
Loading the math board and drawing, please wait…
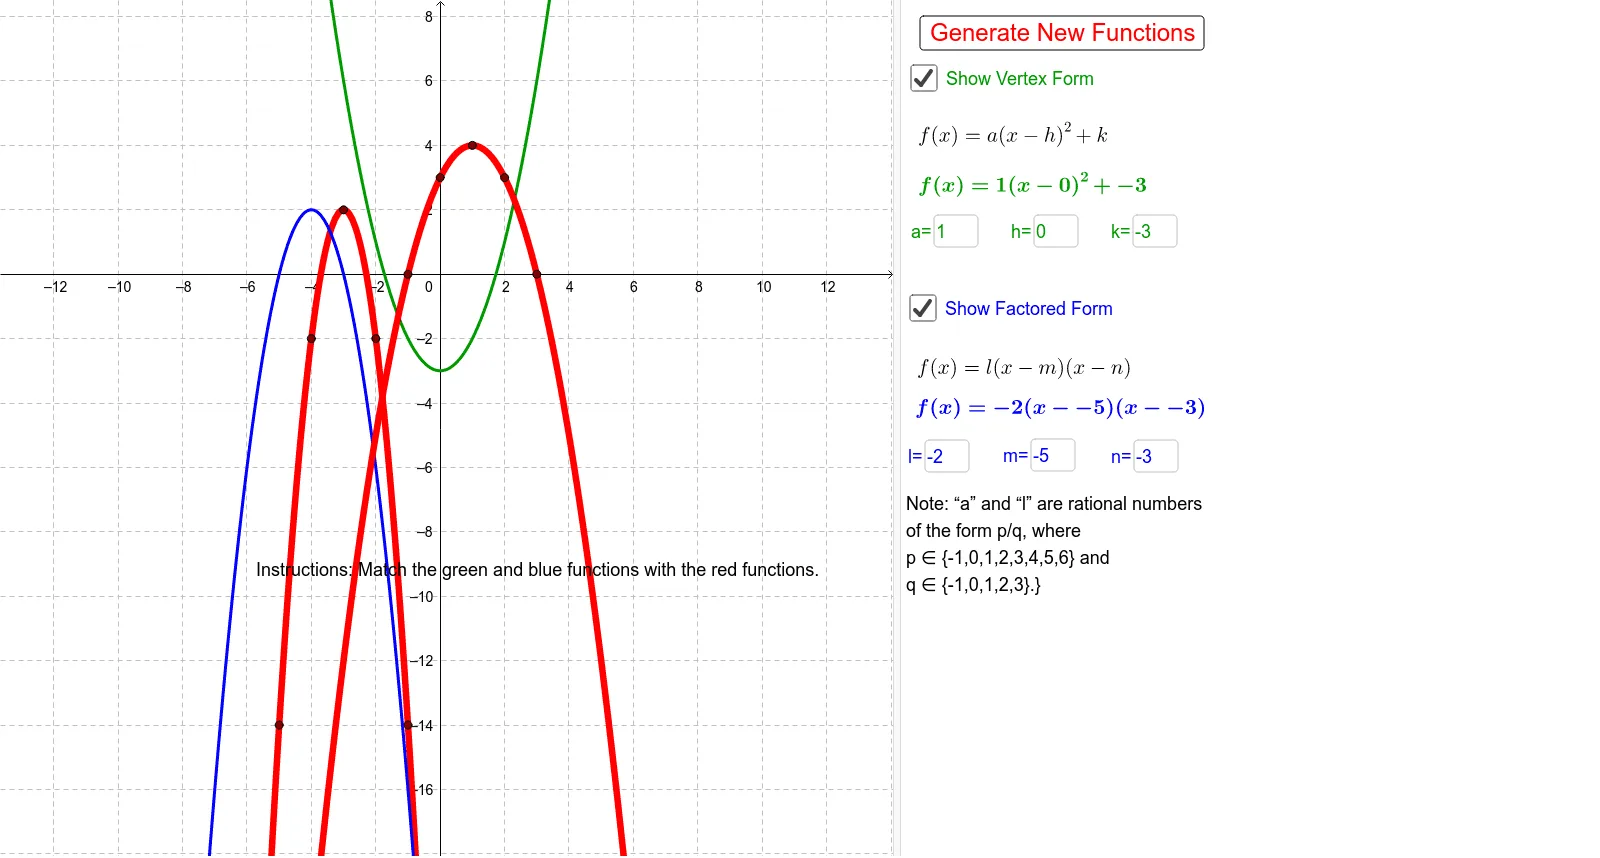
This example demonstrates the relationship between similar triangles and quadratic function graphs, focusing on key concepts like quadratic function properties, similarity ratios, and graph transformations. Construction involves GeoGebra commands such as Random, Textfield, a, h, k, l, m, n, etc. Suitable for high school students learning function graph transformations and coordinate geometry applications, useful for teaching and self-exploration.
GeoGebra Commands & Parameters
Random(1, 6) → pRandom(-8, 8) → rRandom(-6, 6) → sRandom(-1, 3) → qTextfield(a) → inputBox1Textfield(h) → inputBox2Textfield(k) → inputBox3Textfield(l) → inputBox4Textfield(n) → inputBox6Random(-6, 6) → iRandom(-6, 6) → jRandom(1, 2) → dRandom(-1, 1) → eTextfield(m) → inputBox5Textfield(n) → inputBox7
AI Drawing Prompt Reference
Draw two parabolas on a coordinate plane defined by vertex forms y = a(x−h)² + k and y = l(x−m)² + n, with adjustable parameters a, h, k, l, m, n via input boxes; also generate several random points (p, r, s, q, i, j, d, e) as auxiliary points to illustrate the similarity of triangles formed by the curves and their transformations.
The prompt above was compiled from the original drawing commands and is for reference only.