
Graph the Line (v.2): Drag Points A and B
Loading the math board and drawing, please wait…
In collections
Coordinates and Linear Equations
Coordinates and Linear Equations
Coordinates and Linear Equations
Coordinates and Linear Equations
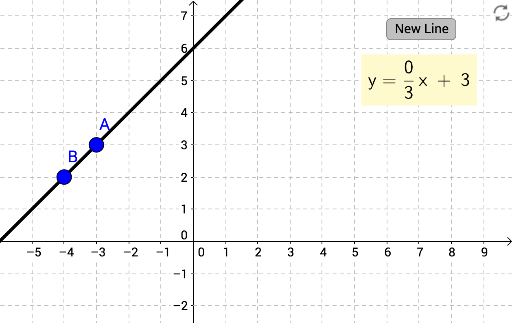
This example demonstrates how to graph a line by dragging two free points A and B, illustrating the fundamental principle that two points determine a line. Core math concepts include slope, y-intercept, and the relationship between points and lines on the coordinate plane. Construction highlights: the Random command generates a random y-intercept and slope (represented by run and rise), points A and B are created as draggable points on the line, a button (button1) allows resetting or generating a new line, and text objects (text1, text2) display relevant values or instructions. Suitable for middle school to high school students learning linear functions, graphing lines, and dynamic geometry exploration, as well as for teachers demonstrating line properties in class.
GeoGebra Commands & Parameters
Random(-4, 4) → generatedyinterceptRandom(1, 6) → generatedrunRandom(-6, 6) → generatedriseLine(A, B) → b