
Graph Shift of Equation x=a When a Increases
Loading the math board and drawing, please wait…
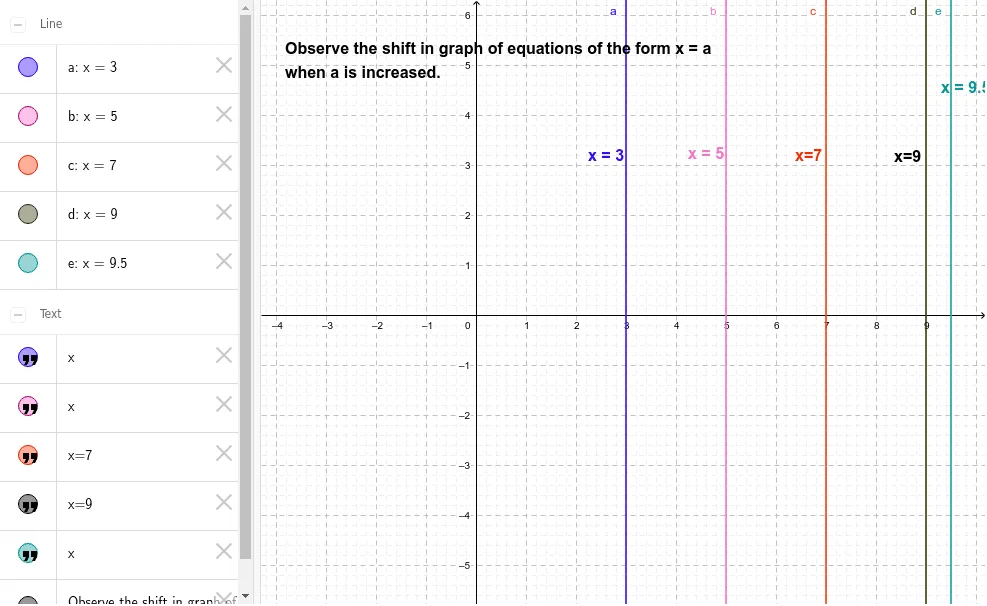
This example demonstrates how the graph of the equation x=a shifts to the right along the x-axis as the parameter a increases. Key math concepts include function graph translation, linear equations in analytical geometry, and coordinate system transformations. Constructed using GeoGebra commands/objects: objects a (parameter), b, c, d, e, text1, text2, text3, text4, text5, text6. Suitable for high school students to learn and understand the rules of function graph transformations, applicable for classroom teaching or homework practice.
GeoGebra Commands & Parameters
Line a(1.0, 0.0, -3.0)Line b(1.0, 0.0, -5.0)Line c(1.0, 0.0, -7.0)Line d(1.0, 0.0, -9.0)Line e(1.0, 0.0, -9.5)