
Graph Quadratic Functions
Loading the math board and drawing, please wait…
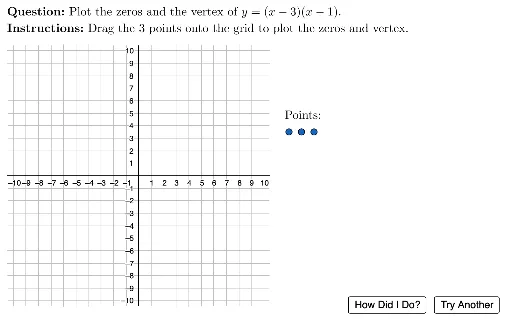
This example demonstrates how to graph quadratic functions, highlighting key features such as the vertex, axis of symmetry, and direction of opening. Core math concepts include quadratic functions, vertex form, axis of symmetry, opening direction, and function graph transformations. It leverages GeoGebra commands like Sequence, Flatten, Point, UnicodeToLetter, LaTeX, Element, Random, Vertex, ActiveLbl, and objects like PointSpace, GridSpace. Suitable for high school students learning to graph quadratic functions and analyze their properties, or for teaching function graph transformations.
GeoGebra Commands & Parameters
Sequence((i, 3.5), i, 12, 15, 1) → PointSpaceFlatten(Sequence[Sequence[(i, j), i, -10, 10, 1], j, -10, 10, 1]) → GridSpacePoint(Union[GridSpace, {Element[PointSpace, 3]}]) → P3Point(Union[GridSpace, {Element[PointSpace, 2]}]) → P2Point(Union[GridSpace, {Element[PointSpace, 1]}]) → P1UnicodeToLetter(10007) → xmarkUnicodeToLetter(10003) → cmarkLaTeX("\text{Points:}") → txtPointLblElement(pValues, Random[1, 4]) → pValElement(tValues, Random[1, 6]) → tValRandom(1, 2) → kValVertex(hintFunc) → vPt, , ,LaTeX(If[pVal ≟ 1, "", If[pVal ≟ -1, "-", ("" * pVal)]]) → txtEqnP1LaTeX(If[sVal ≟ 0, ("" * factor1), (("(" * factor1) * ")")]) → txtEqnP2LaTeX(If[tVal ≟ 0, ("" * factor2), (("(" * factor2) * ")")]) → txtEqnP3LaTeX(chkUserInput) → fbCorrectLaTeX("\text{Plot all three points before \\checking your work.}") → fbNotDoneLaTeX("\text{The three points you should plot are the \\two zeros and the vertex. Please try again.}") → fbTryAgainActiveLbl(activePoint, GridSpace) → pointLabelLaTeX((((((((((((("\text{The zeros are \(" * sVal) * "\) and \( ") * tVal) * "\).}\\ \text{The axis of symmetry is \(x= ") * x(vPt)) * "\).}\\ \text{The \(x\)-coordinate of the vertex is \( ") * x(vPt)) * "\).}\\ \text{Find the \(y\)-coordinate of the vertex by}\\\text{substituting \(x=") * x(vPt)) * "\) into the equation}\\ ") * txtEqn) * ".")) → fbFinalLaTeX((((("\text{\textbf{Question: }" * MainInstruc) * "\\\textbf{Instructions: }") * SpecInstruc) * "}")) → allInstruc
AI Drawing Prompt Reference
Draw a quadratic function graph on a coordinate grid. Show the parabola with its two zeros (x-intercepts) and vertex clearly marked as three distinct points. The grid consists of evenly spaced dots, with three of them highlighted as movable points. The parabola should pass through these three points, and a vertical dashed line should indicate the axis of symmetry through the vertex. Include text labels that state the zeros, the axis of symmetry equation, and the x-coordinate of the vertex, along with instructions to plot all three points before checking the work. The overall layout includes axes, grid dots, and the parabola for practicing quadratic function features.
The prompt above was compiled from the original drawing commands and is for reference only.