
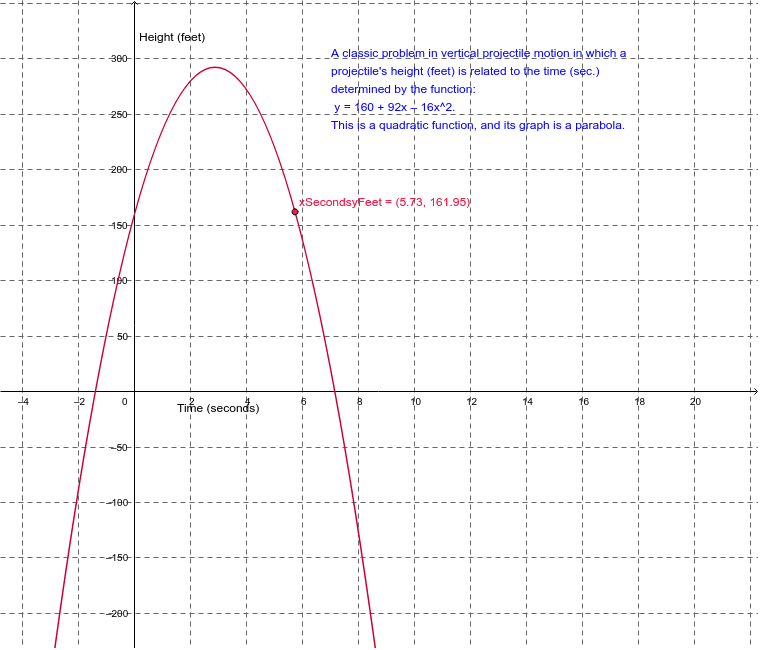
Graph of y = 160 + 92x – 16x²
Loading the math board and drawing, please wait…
In collections
Geom. & Alg.: Quadratics
This example demonstrates the graph of the quadratic function y = 160 + 92x – 16x². It involves the concept of quadratic functions and shows how to construct the function graph using GeoGebra. Commands used include Point and text. Suitable for high school mathematics education, helping students understand the properties and graph characteristics of quadratic functions.
GeoGebra Commands & Parameters
Point(Victory) → xSecondsyFeet
AI Drawing Prompt Reference
Plot the graph of the quadratic function y = 160 + 92x – 16x². Start by entering the function, then draw the graph. Pay attention to the direction of the parabola, the vertex position, and the axis of symmetry.
The prompt above was compiled from the original drawing commands and is for reference only.