
Graph of Cosine Function
Loading the math board and drawing, please wait…
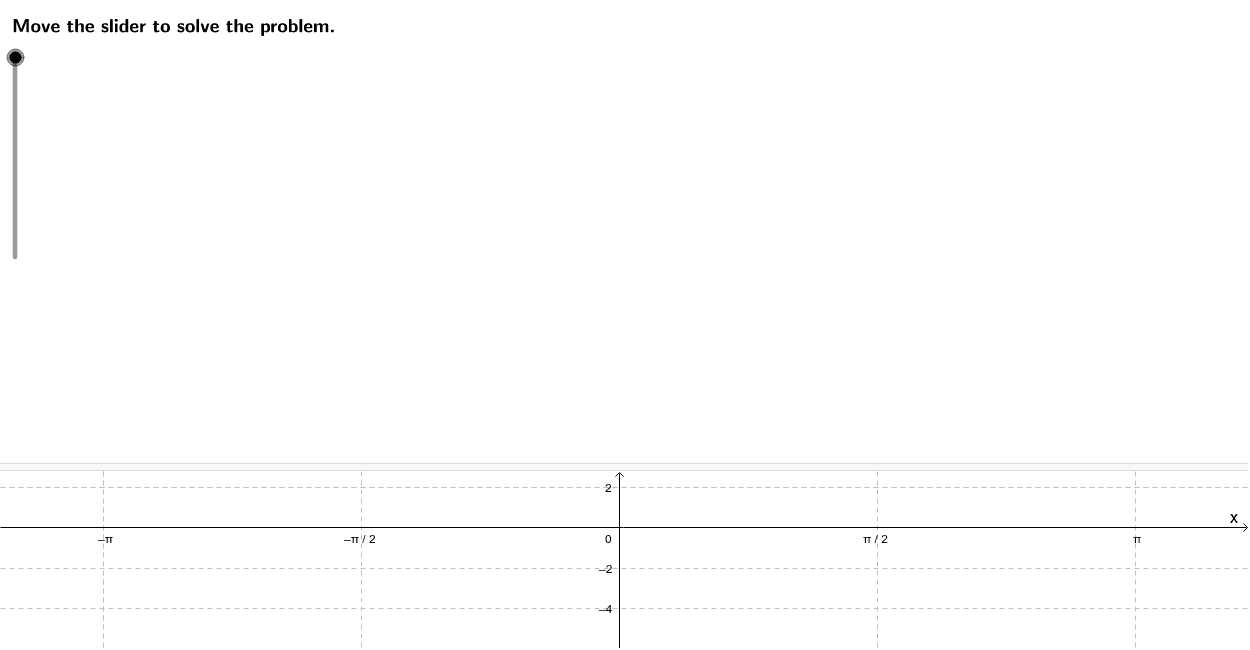
This example demonstrates how to sketch the graph of the function a(x) = –2 + 4 cos 2x over the interval [–π, π]. Key mathematical concepts include trigonometric functions and function graphs. Using GeoGebra commands such as Zip, TableText, and If, the graph can be dynamically displayed. Suitable for high school mathematics education and learning.
GeoGebra Commands & Parameters
Zip(FractionText[a], a, mins) → minlistZip(LaTeX[(a * "\pi")], a, minlist) → minlistfullZip(((u * π), c - abs(a)), u, mins) → minptsZip(LaTeX[((((((((a * "\cos\left((") * b) * ")\left(") * u) * "\right)\right)+(") * c) * ")=") * y(v))], u, minlistfull, v, minpts) → yminlistZip(((u * π), c + abs(a)), u, maxes) → maxptsZip(FractionText[a], a, maxes) → maxlistZip(LaTeX[(a * "\pi")], a, maxlist) → maxlistfullZip(LaTeX[((((((((a * "\cos\left((") * b) * ")\left(") * u) * "\right)\right)+(") * c) * ")=") * y(v))], u, maxlistfull, v, maxpts) → ymaxlistLaTeX(steps) → counterSimplify((b * x)) → argumFractionText(dl) → domleftFractionText(dr) → domrightIf(domleft ≟ "-1", LaTeX["-\pi"], LaTeX[(domleft * "\pi")]) → domLeftIf(domright ≟ "1", LaTeX["\pi"], LaTeX[(domright * "\pi")]) → domRightLaTeX((((((("\textcolor{#000099}{f(x)=" * f) * "}\text{ over }\textcolor{#000099}{\left[") * domLeft) * ",") * domRight) * "\right]}")) → ProblemLaTeX("\text{Identify the amplitude of the function.}") → text1LaTeX("\text{This will help determine the y-axis scale.}") → text2LaTeX("\text{Determine the period of the function.}") → text4LaTeX("\text{Identify any other coefficients or terms that would affect the shape of the graph.}") → text8LaTeX("\text{This is necessary to determine if the graph is translated horizontally or vertically, or if}\cr\text{other mathematical terms affect the graph’s shape.}") → text9LaTeX("\text{This will determine how many cycles of the function show in the given domain.}") → text5LaTeX("\text{Draw and label the axes for your graph.}") → text12LaTeX("\text{The x-axis scale is determined by the given restricted domain.}") → text13LaTeX((((("\text{The x-axis scale will cover at least from }\textcolor{#000099}{" * dl) * "\pi}\text{ to }\textcolor{#000099}{") * dr) * "\pi}.")) → text14LaTeX("\text{The y-axis scale is determined by the amplitude and the vertical shift, if any.}") → text15LaTeX((((("\text{The y-axis scale should cover at least from }\textcolor{#000099}{y = " * Simplify[c - a]) * "}\text{ to }\textcolor{#000099}{y = ") * Simplify[c + a]) * "}.")) → text16Zip(FractionText[a], a, zeros) → zerolistZip(LaTeX[(a * "\pi")], a, zerolist) → zerolistfullZip(((a * π), c), a, zeros) → zeroptsTableText({zerolistfull}) → zerosnqLaTeX("\text{Determine what values of the restricted domain are the maximum and minimum of the}\cr\text{function value(s). List the points corresponding to these extremes, and plot them on the}\cr\text{graph.}") → text21TableText({maxlistfull}) → maxnqTableText({minlistfull}) → minnqLaTeX("\text{Sketch a smooth curve over the given restricted domain.}") → text46LaTeX((((("\text{The cosine argument is }\textcolor{#000099}{" * argum) * "}\text{. Solve }\textcolor{#000099}{") * argum) * "=2\pi}\text{ for }\textcolor{#000099}{x}\text{ to find the period.}")) → text6LaTeX("\text{Determine the values of the restricted domain for which the cosine value(s) equal 0.}\cr\text{List the points corresponding to these zeros, and plot them on the graph.}") → text17LaTeX("\text{The cosine function is zero when its argument is }\textcolor{#000099}{\frac{\pi}{2}\pm n\pi}\text{ where }\textcolor{#000099}{n}\text{ is an integer, }\textcolor{#000099}{0,1,2,\ldots}.") → text18LaTeX((((("\textcolor{#000099}{" * b) * "x=\frac{\pi}{2}\pm n\pi}\cr\textcolor{#000099}{x=") * zerosnq) * "}")) → text19LaTeX("\text{The cosine function has maximums when its argument is }\textcolor{#000099}{\pm2n\pi}\text{ where }\textcolor{#000099}{n}\text{ is an integer.}") → text22LaTeX("\text{The cosine function has minimums when its argument is }\textcolor{#000099}{\pi\pm2n\pi}\text{ where }\textcolor{#000099}{n}\text{ is an integer.}") → text25TableText({ymaxlist}, "v") → ymaxtextTableText({yminlist}, "v") → ymintextZip(LaTeX[((((((((a * "\cos\left((") * b) * ")\left(") * u) * "\right)\right)+(") * c) * ")=") * y(v))], u, zerolistfull, v, zeropts) → yzeroTableText({yzero}, "v") → yzerotextFractionText(permult) → permulttextLaTeX((((((((((((("\textcolor{#000099}{x=\frac{2}{" * b) * "}\pi}\text{ The period is }\textcolor{#000099}{") * permult) * "\pi}.\cr\text{The number of cycles in the domain is }\textcolor{#000099}{\frac{domain}{period}=\frac{") * domRight) * "-") * domLeft) * "}{") * permulttext) * "\pi}=") * cycles) * "}.")) → text7LaTeX("\text{Move the slider to solve the problem.}") → text0LaTeX("\text{Use the buttons below to return to the original problem or}\cr\text{randomly generate a similar practice problem.}") → text47LaTeX((("\text{The corresponding y-values are: }\textcolor{#000099}{" * yzerotext) * "}")) → text20LaTeX((("\text{The corresponding y-values are: }\textcolor{#000099}{" * ymintext) * "}")) → text27LaTeX((((("\text{The coefficient of the cosine function is }\textcolor{#000099}{" * a) * "}\text{; therefore, the amplitude is }\textcolor{#000099}{") * a) * "}.")) → text3LaTeX("\text{The cosine argument has no constant term, so there is no horizontal shift.}") → text10If(c ≟ 0, LaTeX["\text{The function has no constant term, so there is no vertical shift.}"], If[c > 0, LaTeX[(((("\text{The constant term }\textcolor{#000099}{+" * c) * "}\text{ in the function means the cosine function will be shifted up by }\textcolor{#000099}{") * abs(c)) * "}.")], LaTeX[(((("\text{The constant term }\textcolor{#000099}{" * c) * "} \text{ in the function means the sine function will be shifted down by }\textcolor{#000099}{") * abs(c)) * "}.")]]) → text11LaTeX((("\text{The corresponding y-values are: }\textcolor{#000099}{" * ymaxtext) * "}")) → text24LaTeX((((("\textcolor{#000099}{" * b) * "x=\pi\pm 2n\pi} \to \textcolor{#000099}{x=") * minnq) * "}")) → text26LaTeX((((("\textcolor{#000099}{" * b) * "x=\pm 2n\pi} \to \textcolor{#000099}{x=") * maxnq) * "}")) → text23
AI Drawing Prompt Reference
Draw the graph of the function a(x) = –2 + 4 cos 2x over the interval [–π, π], highlighting amplitude, period, and vertical shift. Start by labeling the x and y axes, then determine the y-axis scale based on the amplitude and vertical shift. Identify and plot the zeros, maxima, and minima of the function. Finally, sketch a smooth curve through these points to complete the graph.
The prompt above was compiled from the original drawing commands and is for reference only.