
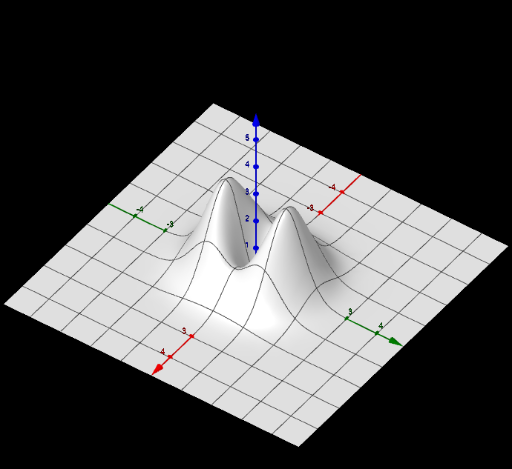
Graph of a Function of Two Variables
Loading the math board and drawing, please wait…
This example demonstrates the graph of a function of two variables, involving key mathematical concepts such as functions, angles, and multiplication. The construction summary shows that the graph uses text fields to display variable a and related text. Suitable for middle school math education to help students understand the characteristics of the graph of a function of two variables.
GeoGebra Commands & Parameters
Textfield(a) → Εισ1