
Graph Derivatives of sinx and cosx
Loading the math board and drawing, please wait…
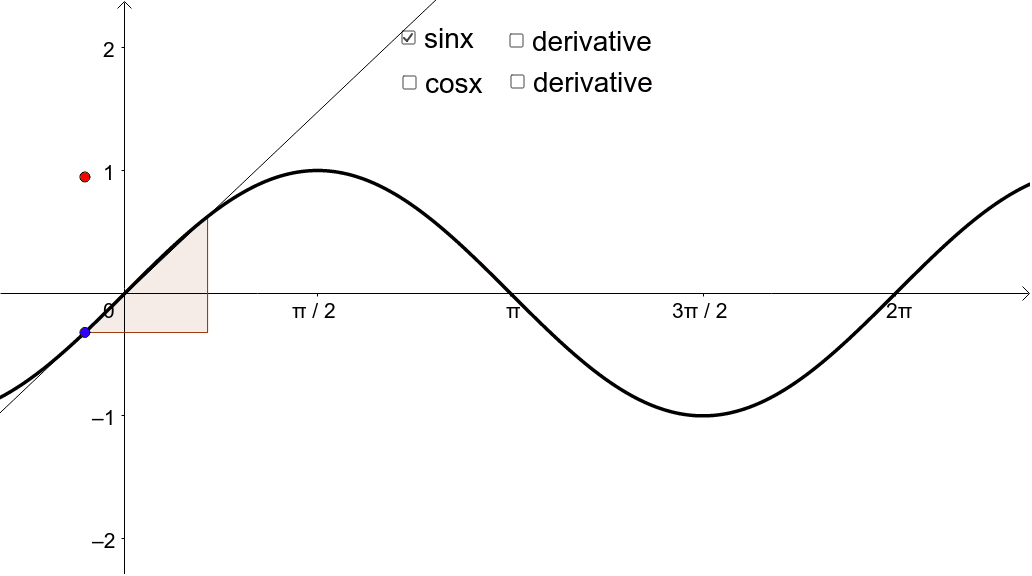
This example demonstrates how to graph the derivatives of the sine function sin(x) and the cosine function cos(x). By moving the blue point, you can trace the derivative. Key math concepts include the geometric meaning of derivatives and properties of trigonometric functions. Construction highlights the use of GeoGebra commands and objects like Point, Tangent, Slope, and Derivative. Suitable for high school students learning calculus to visually understand the concept of derivatives.
GeoGebra Commands & Parameters
Point(f) → ATangent(A, f) → tSlope(t) → sDerivative(f) → f'Point(g) → CTangent(C, g) → bSlope(b) → slopebDerivative(g) → g'
AI Drawing Prompt Reference
Draw the graphs of sine and cosine functions. Place a movable point on each curve. Through each point, draw a tangent line to its respective curve and display the slope value of that tangent. Also plot the derivative curves of both functions, which are cosine and negative sine respectively. As the points move along the curves, the tangent lines and slope values update dynamically, illustrating the relationship between derivatives and tangent slopes. The figure should include coordinate axes, the function curves, tangent lines, slope labels, and derivative curves, arranged clearly for comparing each function with its derivative.
The prompt above was compiled from the original drawing commands and is for reference only.