
Graph a Line by Sarah Crofford
Loading the math board and drawing, please wait…
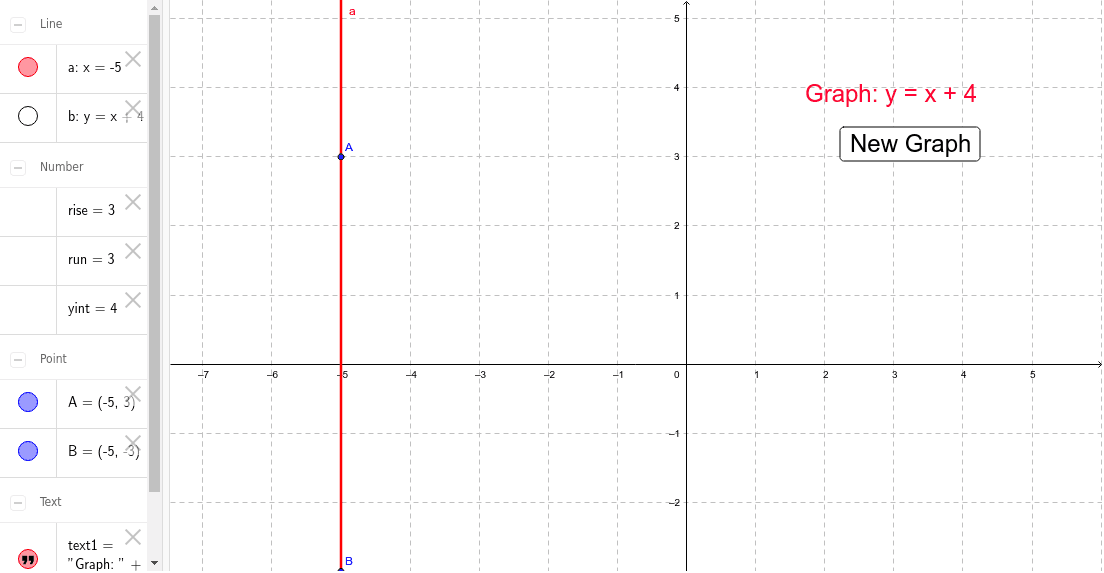
This example demonstrates how to use GeoGebra to graph a line. Key mathematical concepts include the equation of a line and coordinate geometry. By using commands like Line, Random, and RandomElement, random lines can be generated and observed. Suitable for students in middle school and above to learn about the equation of a line and coordinate geometry.
GeoGebra Commands & Parameters
Line(A, B) → aRandom(-5, 5) → yintRandomElement({1, 2, 3, 4, 5}) → runRandom(-5, 5) → rise
AI Drawing Prompt Reference
Draw a randomly generated line where the y-intercept and slope are randomly chosen between -5 and 5. The y-intercept is a point on the y-axis, and the slope indicates the line's steepness. First, determine two random points, then draw the line using these points to show the relationship between the line's equation and coordinate geometry.
The prompt above was compiled from the original drawing commands and is for reference only.