
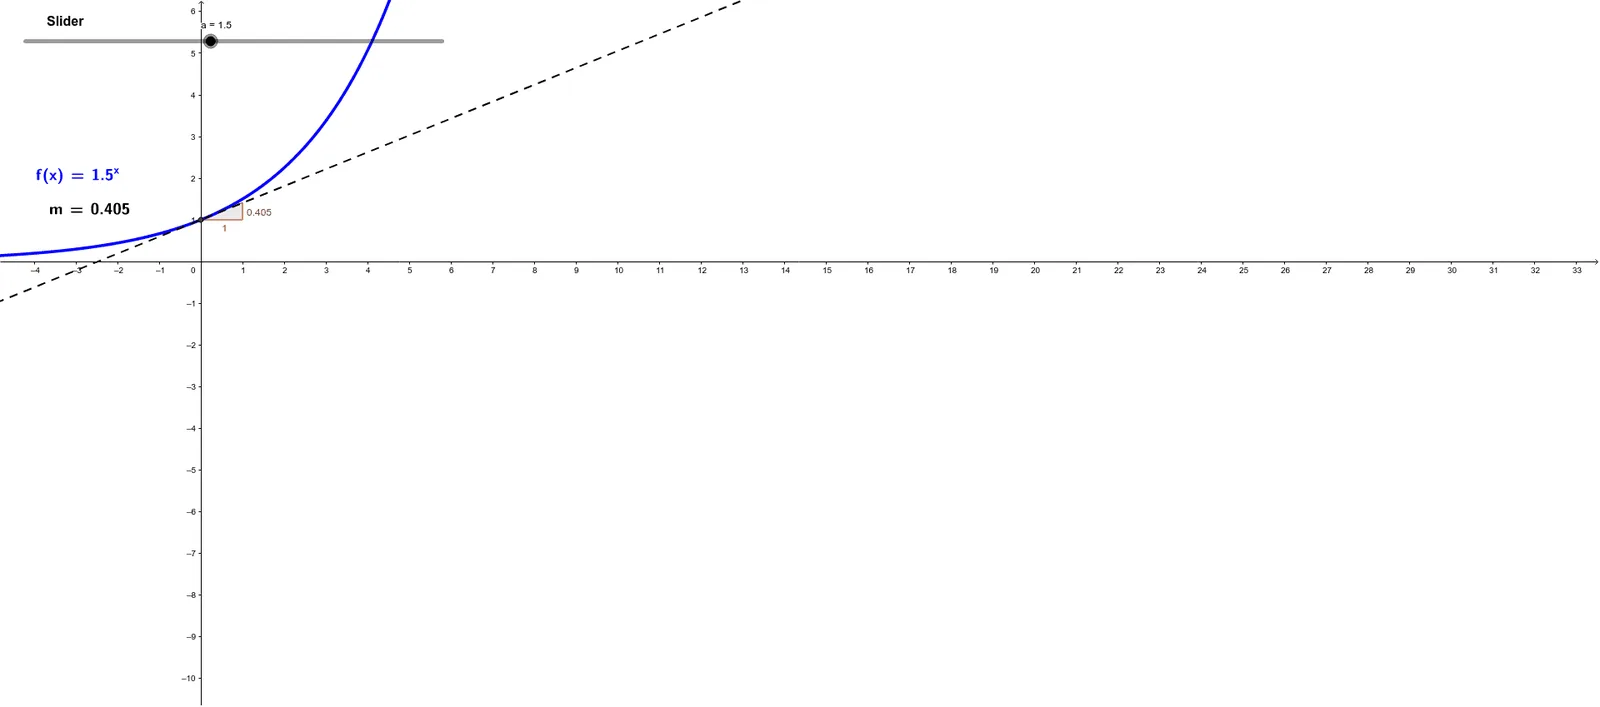
Gradient of Exponential Function at x=0
Loading the math board and drawing, please wait…
This example demonstrates the calculation of the slope of the tangent line for an exponential function at x=0. It involves core mathematical concepts such as exponential functions, derivatives, tangent slope, and similar triangles. The construction uses GeoGebra commands like Intersect, Tangent, Slope, and LaTeX, along with objects like a (function), f (function graph), A (point), b (point), m (slope), and text elements. Suitable for high school calculus students to understand the geometric meaning of derivatives.
GeoGebra Commands & Parameters
Intersect(f, yAxis, (0, 1)) → ATangent(A, f) → bSlope(b) → mLaTeX(f, true, true) → text1LaTeX(m, true, true) → text2
AI Drawing Prompt Reference
Draw the graph of an exponential function. Mark the point where the curve intersects the y-axis. At this point, construct the tangent line to the curve)Skip. Display the slope of this tangent line as a numeric value. Add text labels showing the function expression and the slope value to illustrate the geometric meaning of the derivative.
The prompt above was compiled from the original drawing commands and is for reference only.