
Gradient from Two Given Points - Geometric Demonstration
Loading the math board and drawing, please wait…
In collections
Linear functions
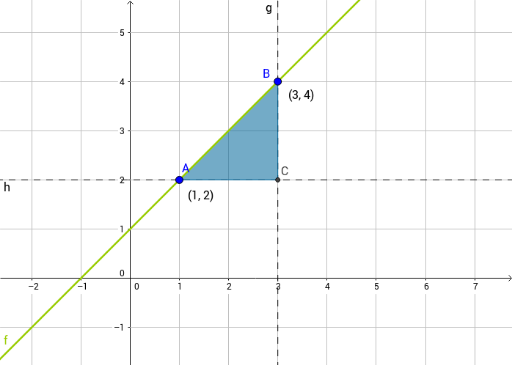
This GeoGebra example dynamically demonstrates how to compute the gradient (slope) of a line passing through two given points, visually linking the slope value to the coordinates of the points. The core mathematical concept is the slope formula in coordinate geometry: the ratio of the vertical difference to the horizontal difference between two points, along with perpendicular and parallel line relationships. Construction details: the commands OrthogonalLine, Line, Intersect, and Polygon are used; objects include points A and B, lines f, g, h, intersection point C, polygon poly1, and text objects text1 and text2 that display the calculation steps. Suitable for upper middle school or high school students learning slope concepts, and for teachers to illustrate the transition from geometric intuition to algebraic computation.
GeoGebra Commands & Parameters
OrthogonalLine(B, xAxis) → gLine(A, B) → fOrthogonalLine(A, g) → hIntersect(g, h) → CPolygon(A, C, B) → poly1, b, a, c
AI Drawing Prompt Reference
Draw a coordinate plane with two given points. Connect them with a straight line. From one point, draw a vertical line perpendicular to the x-axis. From the other point, draw a horizontal line perpendicular to that vertical line. These two lines intersect at a third point, forming a right triangle with the two original points. Fill the triangle with a semi-transparent color. Label the coordinates of the two points and display the slope calculation as the ratio of vertical difference to horizontal difference. The diagram should clearly show the geometric relationship between the slope and the triangle's sides, suitable for classroom demonstration.
The prompt above was compiled from the original drawing commands and is for reference only.