
Goodness of Fit Test Demonstration
Loading the math board and drawing, please wait…
In collections
Learn GeoGebra Classic
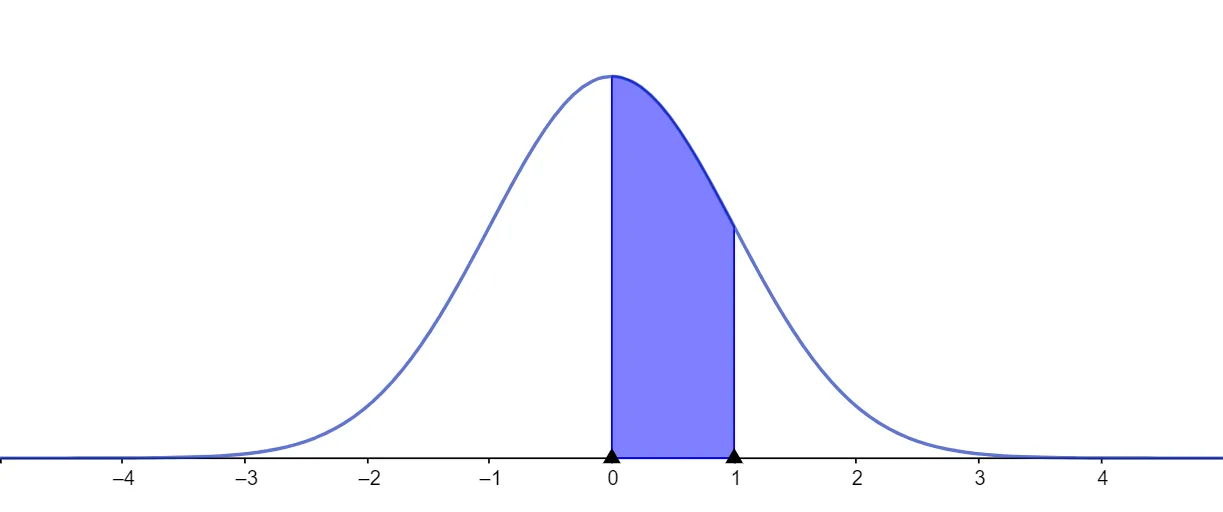
This example demonstrates how to conduct a Goodness of Fit Test, visually showing the match between data and theoretical distributions. Core math concepts include probability & statistics, hypothesis testing, and data distribution analysis. Construction highlights involve using sliders to adjust parameters, plotting data points and theoretical distribution curves, and calculating test statistics. Suitable for high school students and beginners in statistics.
AI Drawing Prompt Reference
Create a goodness of fit test example with theoretical distribution curves and data points. Use sliders to adjust parameters and show the match between data and theoretical distributions. First, draw the theoretical distribution curve, then add data points, and finally calculate and display the test statistic.
The prompt above was compiled from the original drawing commands and is for reference only.