
Global Tax Comparison with Graph Intersections
Loading the math board and drawing, please wait…
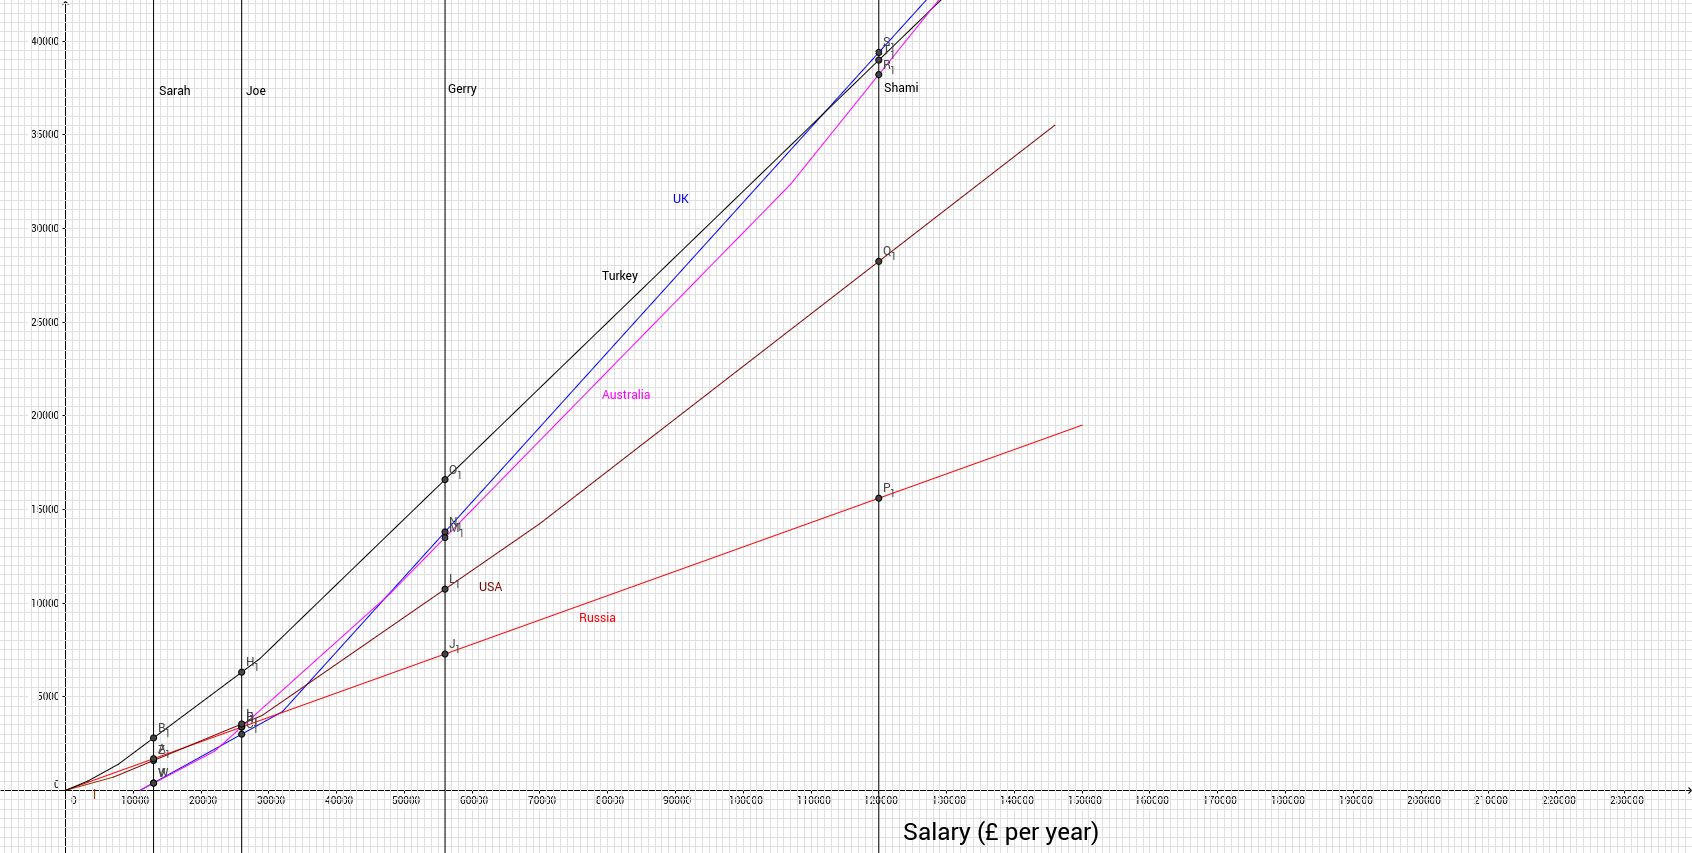
This example demonstrates the intersection of function graphs by plotting tax data from different countries. Key math concepts include function graphs, coordinate geometry, and inequality solving. GeoGebra commands used are Segment, Point, Intersect, with objects like A1, B1, A, B, C, D, f, g, etc. Suitable for high school mathematics education to understand the application of function intersections in real-world data.
GeoGebra Commands & Parameters
Segment(A, B) → fSegment(B, C) → gSegment(C, D) → UKSegment(A, E) → RussiaPoint(UK) → FPoint(UK) → GSegment(H, I) → hSegment(I, J) → AustraliaSegment(K, L) → iSegment(L, M) → jSegment(M, N) → TurkeySegment(O, P) → kSegment(P, Q) → USASegment(Q, R) → mSegment(A, O) → lSegment(H, B) → nSegment(S, J) → pPoint(i) → TIntersect(f, Russia) → USegment(T, U) → qIntersect(Sarah, g) → VIntersect(Sarah, n) → WIntersect(Sarah, k) → ZIntersect(Sarah, Russia) → A_1Intersect(Sarah, j) → B_1Intersect(Joe, g) → C_1Intersect(Joe, Russia) → D_1Intersect(Joe, h) → E_1Intersect(Joe, j) → H_1Intersect(Joe, k) → I_1Intersect(Gerry, Russia) → J_1Intersect(Gerry, USA) → L_1Intersect(Gerry, Australia) → M_1Intersect(Gerry, UK) → N_1Intersect(Gerry, Turkey) → O_1Intersect(Shami, Russia) → P_1Intersect(Shami, m) → Q_1Intersect(Shami, p) → R_1Intersect(Shami, UK) → S_1Intersect(Shami, Turkey) → T_1