
Geometric Visualization of Fraction Comparison using Sectors and Segments
Loading the math board and drawing, please wait…
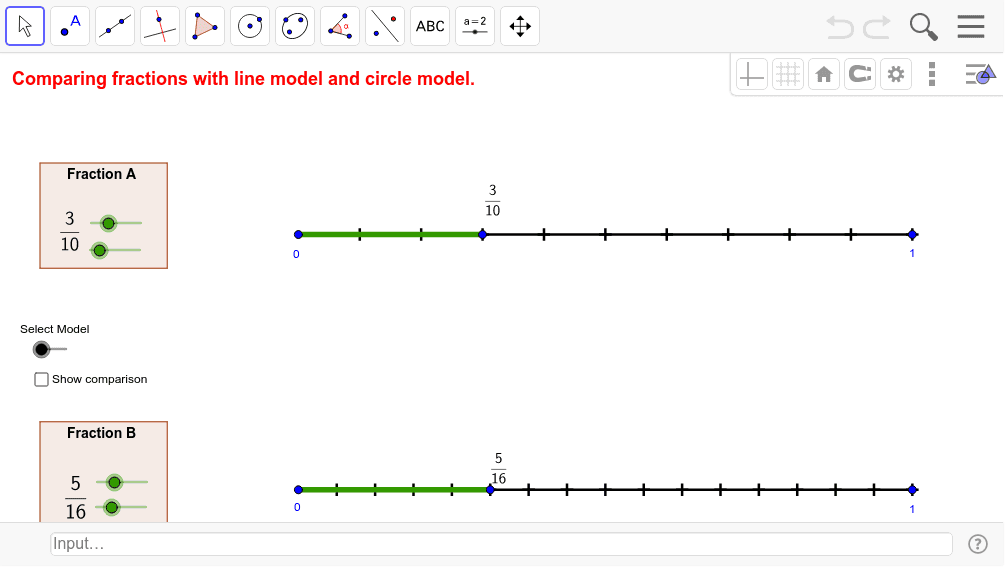
This GeoGebra applet demonstrates the visual comparison of fractions using geometric models. It covers core concepts like fraction equivalence, inequality, and area representation. Construction utilizes commands such as Segment for baseline, Circle and CircleSector for pie chart representations of denominators and numerators, Rotate for angular adjustment, and Polygon for structural support. Ideal for middle school students to grasp abstract fraction concepts visually, suitable for classroom teaching or self-study in mathematics education.
GeoGebra Commands & Parameters
Segment(A, A + (unitsize1, 0)) → line1Segment(B, B + (unitsize2, 0)) → line2Sequence((x(A) + i * unitsize1 / denominator1, y(A)), i, 1, denominator1) → numdots1Sequence((x(B) + i * unitsize2 / denominator2, y(B)), i, 1, denominator2) → numdots2Segment(E, (x(E), y(E) - (y(A) - y(B)))) → showcomparison_1Segment(A, E) → showfrac1_1Segment(B, F) → showfrac2_1Circle(G, unitradius) → cPoint(c) → HSegment(G, H) → aRotate(G, 360 * ° / denominator1, G) → G'Sequence(Segment[Rotate[G, i * 360 * ° / denominator1, G], Rotate[H, i * 360 * ° / denominator1, G]], i, 1, denominator1) → denominatorwedges1Circle(I, unitradius) → dPoint(d) → JSegment(I, J) → bSequence(Segment[Rotate[I, i * 360 * ° / denominator2, I], Rotate[J, i * 360 * ° / denominator2, I]], i, 1, denominator2) → denominatorwedges2Rotate(H, numerator1 * 360 * ° / denominator1, G) → H'Rotate(J, numerator2 * 360 * ° / denominator2, I) → J'CircleSector(G, H, H') → numeratorwedge1CircleSector(I, J, J') → numeratorwedge2Polygon(K, (x(K), y(K) - boxheight), (x(K) + boxwidth, y(K) - boxheight), (x(K) + boxwidth, y(K))) → poly1, e, f, g, hPolygon(L, (x(L), y(L) - boxheight), (x(L) + boxwidth, y(L) - boxheight), (x(L) + boxwidth, y(L))) → poly2, l, i, j, k
AI Drawing Prompt Reference
Create a geometric visualization to compare fractions using sectors and segments. Draw two baseline segments and mark points along them representing numerators and denominators. Use circles and sectors to represent the denominators, dividing each into the corresponding number of sectors. Then, use another color for circles and sectors to represent the other fraction. Rotate the sectors so one covers part corresponding to the numerator. Finally, add polygons as a background to make the diagram clearer.
The prompt above was compiled from the original drawing commands and is for reference only.