
Geometric Representation of ax²+bx+c>0
Loading the math board and drawing, please wait…
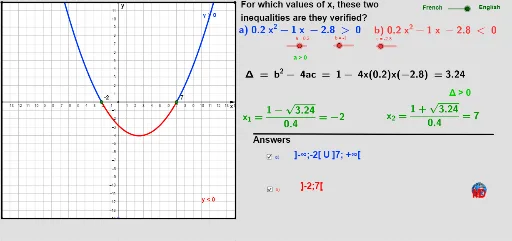
This example demonstrates the geometric representation of the quadratic inequality ax²+bx+c>0. Key mathematical concepts include quadratic functions, parabolas, and inequalities. Using GeoGebra commands such as Point, Vector, Intersect, etc., the dynamic display of the quadratic function graph and its intersection with the x-axis is shown. Suitable for high school mathematics education and learning about quadratic functions and their properties.
GeoGebra Commands & Parameters
Point(xAxis) → APoint(xAxis) → BVector(A, B) → uPoint(yAxis) → CPoint(yAxis) → DVector(C, D) → vOrthogonalLine(D, yAxis) → dOrthogonalLine(A, xAxis) → eOrthogonalLine(B, xAxis) → gIntersect(d, e) → EIntersect(d, g) → FIntersect(f, g) → GIntersect(f, e) → HSegment(A, B) → hPoint(h) → IIf(f(x(I)) < y(D) ∧ f(x(I)) > 0, f(x(I)), 100) → yhautIntersect(yAxis, g) → KIntersect(h, xAxis) → LLine(C, xAxis) → iIntersect(e, i) → MIntersect(g, i) → NIntersect(p, xAxis) → O, PIf(f(x(I)) < y(D) ∧ f(x(I)) > y(C) ∧ f(x(I)) ≤ 0, f(x(I)), 100) → ybasLocus(Q, I) → lieu2Locus(R, I) → lieu1Polygon(M, N, F, E) → Poly2, m, n, f_1, e_1Intersect(xAxis, yAxis) → SIf(Delta ≥ 0 ∧ x(P) < x(B), "" + (x(P))) → Texte1If(Delta ≥ 0 ∧ x(O) > x(A), "" + (x(O))) → Texte2If(b > 0, "+", If[b < 0, "-", "0"]) → zzIf(b > 0, "+", If[b < 0, "-", "0"]) → zbIf(b < 0, "-") → sib1If(b > 0, "+", If[b < 0, "-", "+"]) → sib2If(c > 0, "+", If[c < 0, "-", "+"]) → zcIf(a > 0 ∧ Delta > 0, "]-∞;" + (x(O)) + "[ U ]" + (x(P)) + "; +∞[") → Texte14If(a > 0 ∧ Delta > 0, "]" + (x(O)) + ";" + (x(P)) + "[") → Texte27If(a > 0 ∧ Delta < 0, "pas de solution") → Texte26If(Delta < 0 ∧ a > 0, "]-∞; +∞[") → Texte15If(a > 0 ∧ Delta ≟ 0, "Pas de solution") → Texte30If(Delta ≟ 0, "]-∞;" + ((-(b / ((2 * a))))) + "[ U ]" + ((-(b / ((2 * a))))) + ";+∞[") → Texte23Polygon(V, W, Z, A_1) → poly1, v_1, w, z, a_1Segment(B_1, C_1) → lIf(a ≟ 0 ∧ b < 0 ∧ (j ≟ true ∨ k ≟ true), "]-∞; " + ((-(c / b))) + "[") → Texte32If(a ≟ 0 ∧ b > 0 ∧ (j ≟ true ∨ k ≟ true), "]" + ((-(c / b))) + "; +∞[") → Texte22If(a ≟ 0 ∧ b > 0 ∧ (j ≟ true ∨ k ≟ true), "]-∞; " + ((-(c / b))) + "[") → Texte31If(a < 0 ∧ Delta > 0, "]-∞;" + (x(O)) + "[ U ]" + (x(P)) + "; +∞[") → Texte17If(Delta < 0 ∧ a < 0, "]-∞; +∞[") → Texte18If(a ≟ 0 ∧ b < 0 ∧ (j ≟ true ∨ k ≟ true), "]" + ((-(c / b))) + "; +∞[") → Texte33If(a < 0 ∧ Delta > 0, "]" + (x(O)) + ";" + (x(P)) + "[") → Texte28If(a < 0 ∧ Delta < 0, "Pas de solution") → Texte25If(a ≟ 0 ∧ b ≟ 0 ∧ c ≟ 0 ∧ (j ≟ true ∨ k ≟ true), "Pas de solution") → Texte38If(a ≟ 0 ∧ b ≟ 0 ∧ c > 0 ∧ (j ≟ true ∨ k ≟ true), "Pas de solution") → Texte37If(a ≟ 0 ∧ b ≟ 0 ∧ c < 0 ∧ (j ≟ true ∨ k ≟ true), "]-∞; +∞[") → Texte34If(a ≟ 0 ∧ b ≟ 0 ∧ c < 0 ∧ (j ≟ true ∨ k ≟ true), "Pas de solution") → Texte35If(a ≟ 0 ∧ b ≟ 0 ∧ c > 0 ∧ (j ≟ true ∨ k ≟ true), "]-∞; +∞[") → Texte36Point(f_1) → D_1Point(f_1) → E_1Polygon(E_1, N, M, D_1) → poly2, e_2, n_1, m_1, d_1
AI Drawing Prompt Reference
Draw the graph of a quadratic function, showing its intersections with the x-axis and highlighting the regions where the function is greater than zero. Start by drawing the x-axis and y-axis, then mark two points on the x-axis and connect them to form a line segment. Do the same on the y-axis. Draw perpendicular lines from these points to the axes, find their intersections, and use these points to create a polygon. Color the area where the function is positive.
The prompt above was compiled from the original drawing commands and is for reference only.