
Geometric Construction & Probability Demo
Loading the math board and drawing, please wait…
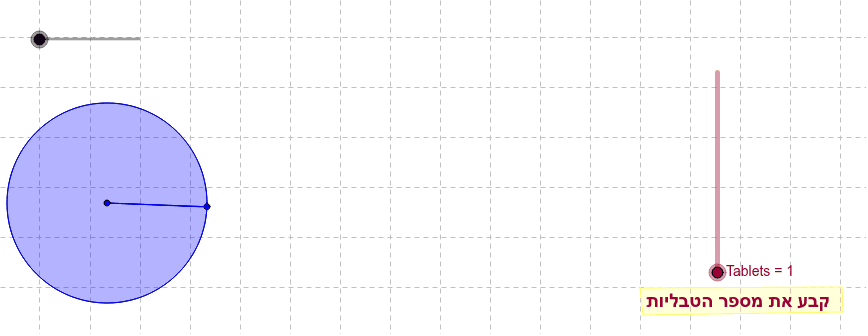
This example dynamically demonstrates geometric constructions and their integration with probability & statistics, focusing on circles, polygons, and loci. Core math concepts include circle, polygon, binomial distribution, and hypothesis testing. GeoGebra commands used are Circle, Point, Segment, Append, CircleSector, Zip, Polygon. Suitable for high school and above mathematics education for visual learning of geometric constructions and probability statistics.
GeoGebra Commands & Parameters
Circle(C_2, r) → d_2Point(d_2) → D_2Circle(A, r) → cPoint(c) → BSegment(A, B) → aAppend(Sequence[Rotate[B, i, A], i, (360 / T1)°, 359.9*°, (360 / T1)°], Rotate[B, 359.99*°, A]) → ListPCircleSector(A, B, Element[ListP, i]) → ShadeCircle(C, r) → dPoint(d) → DAppend(Sequence[Rotate[D, s, C], s, (360 / T2)°, 359.9*°, (360 / T2)°], Rotate[D, 359.99*°, C]) → ListP2CircleSector(C, D, Element[ListP2, j]) → Shade2Segment(C, D) → bZip(Segment[C, W], W, ListP2) → ListS2Zip(Segment[A, Z], Z, ListP) → ListSCircle(C_1, r) → d_1Point(d_1) → D_1Segment(C_2, D_2) → b_1Append(Sequence[Rotate[D_2, s, C_2], s, (360 / T3)°, 359.9*°, (360 / T3)°], Rotate[D_2, 359.99*°, C_2]) → ListP2_1Circle(C_3, r) → d_3Point(d_3) → D_3Segment(C_3, D_3) → b_2Zip(Segment[C_3, CLIPBOARDmagicSTRINGW], CLIPBOARDmagicSTRINGW, ListP2_1) → ListS2_1CircleSector(C_3, D_3, Element[ListP2_1, j_1]) → Shade2_1Circle(C_4, r_1) → d_4Circle(C_5, r_2) → d_5Polygon(E, F, G, H) → poly1, e, f, g, h
AI Drawing Prompt Reference
Create a dynamic geometric construction integrating probability and statistics, featuring circles, polygons, and loci. Start by drawing a circle and placing a point on it. Then, draw another circle with a different center, connect the centers with a line segment. Rotate the segment to generate multiple sectors, showing the locus. Add more circles, points, and line segments, forming polygons. The final image should display a complex geometric pattern that illustrates the connection between probability statistics and geometry.
The prompt above was compiled from the original drawing commands and is for reference only.