
Geogebra Probability and Geometry Exercise
Loading the math board and drawing, please wait…
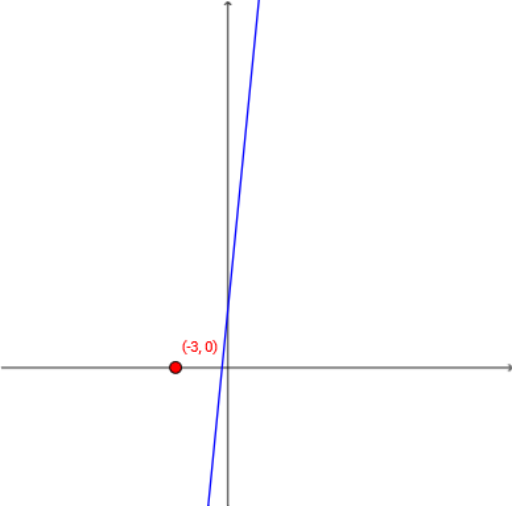
This example demonstrates the integration of probability and geometry through dynamic interaction, showing how to generate angles and lines using random numbers and calculate standard deviation. Core math concepts include probability & statistics, angle calculations, circle-line relationships, arithmetic operations, and standard deviation. Constructed using commands like Random, RandomElement, Textfield, TableText in GeoGebra for data generation and display. Suitable for high school mathematics teaching, aiding in the practice and understanding of probability statistics and geometric constructions.
GeoGebra Commands & Parameters
Random(-10, 10) → d_2Random(-10, 10) → bRandom(-10, 10) → aRandomElement({-5, -4, -3, -2, -1, 1, 2, 3, 4, 5}) → cRandomElement({-5, -4, -3, -2, -1, 1, 2, 3, 4, 5}) → a_1Textfield(h) → InputBox1Random(-10, 10) → b_1RandomElement({-5, -4, -3, -2, -1, 1, 2, 3, 4, 5}) → c_1Random(-10, 10) → d_1Textfield(m) → InputBox2Textfield(f) → InputBox4TableText({{A1_1, B_1, C_1, D_1}, {-3, g(-3), h(-3), f(-3)}, {-2, g(-2), h(-2), f(-2)}, {-1, g(-1), h(-1), f(-1)}, {0, g(0), h(0), f(0)}, {1, g(1), h(1), f(1)}, {2, g(2), h(2), f(2)}, {3, g(3), h(3), f(3)}, {1, e, l, k}}, "|_r") → text3_1
AI Drawing Prompt Reference
Create a dynamic geometric illustration showing how to generate angles and lines using random numbers and calculate standard deviation. Include randomly generated points and lines with their relationships, and display data through input boxes and tables, suitable for high school mathematics teaching.
The prompt above was compiled from the original drawing commands and is for reference only.