
GeoGebra Geometric and Probability Distribution Example
Loading the math board and drawing, please wait…
In collections
Constructions for Problem Set 2
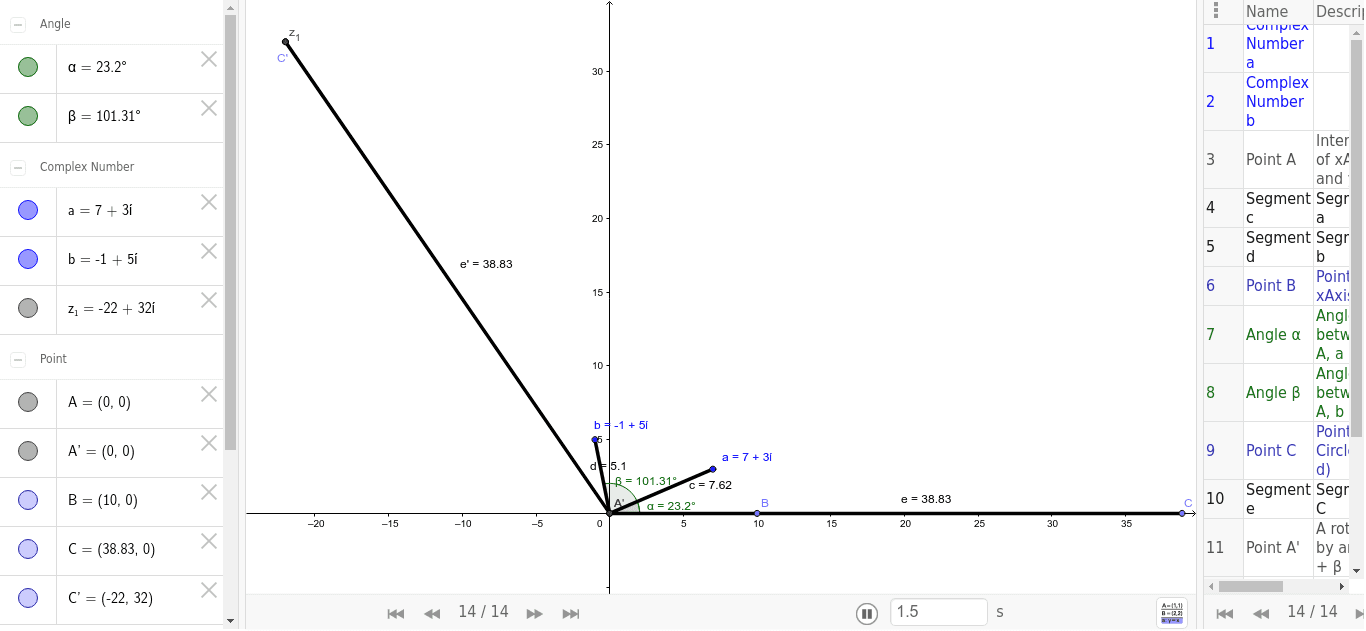
This example demonstrates how to create geometric figures and probability distribution graphs using GeoGebra. Key mathematical concepts include geometric construction, trigonometry, and probability statistics. Construction involves commands like Intersect, Segment, Point, Angle, and Rotate, using objects such as a, b, A, c, d, B, α, β, C, e. Suitable for high school students or math enthusiasts to learn basic geometry and probability.
GeoGebra Commands & Parameters
Intersect(xAxis, yAxis) → ASegment(A, a) → cSegment(A, b) → dPoint(xAxis) → BAngle(B, A, a) → αAngle(B, A, b) → βPoint(Circle[A, (c * d)]) → CSegment(A, C) → eRotate(A, α + β, A) → A'Rotate(C, α + β, A) → C'Segment(A', C') → e'
AI Drawing Prompt Reference
Draw a figure formed by two intersecting axes with points A and B on the axes. Connect A to points a and b to form segments c and d. Take point B on the axis and measure angles α and β. Construct a circle with center A and radius equal to c times d, taking point C on the circle. Connect A to C to form segment e. Rotate points A and C by the angle α plus β to get A' and C'. Finally, connect A' and C' to form segment e'. The figure illustrates geometric construction and angle relationships.
The prompt above was compiled from the original drawing commands and is for reference only.