
Graphing Quadratic Functions by Mark Watford
Loading the math board and drawing, please wait…
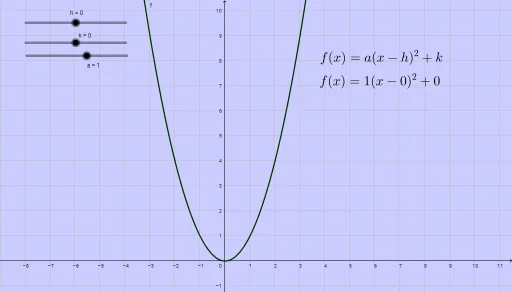
This example demonstrates how to graph quadratic functions y=ax²+bx+c dynamically using GeoGebra, adjusting parameters like vertex (h,k), axis of symmetry, and direction of opening. Key math concepts include quadratic functions, vertex form, symmetry, and transformations. Construction involves commands like sliders (h, k, a), points (p, q, r), and text objects (text1, text2) for visualization and control. Ideal for high school mathematics education to explore properties and transformations of quadratic graphs.
GeoGebra Commands & Parameters
Numeric h(0)Numeric k(0)Numeric a(1)f(x) = (a * (x - h)^(2)) + kg(x) = x^(2) - (8 * x) + 15p(x) = (x - 4)^(2) - 1q(x) = (x - 1)^(2) + 2r(x) = (2 * (x + 2)^(2)) - 1y - 3 = (x - 1)^(2)t(x) = x^(2) + (4 * x) - 1f_1(x) = x^(2) - (2 * x) - 15g_1(x) = x^(2) + (6 * x) + 3h_1(x) = (3 * x^(2)) - (2 * x) - 4s(x) = (x - 3)^(2) + 2