
GeoGebra Gas Mileage Estimation Example
Loading the math board and drawing, please wait…
In collections
UCSS Secondary Math I Unit 4 Lesson 2
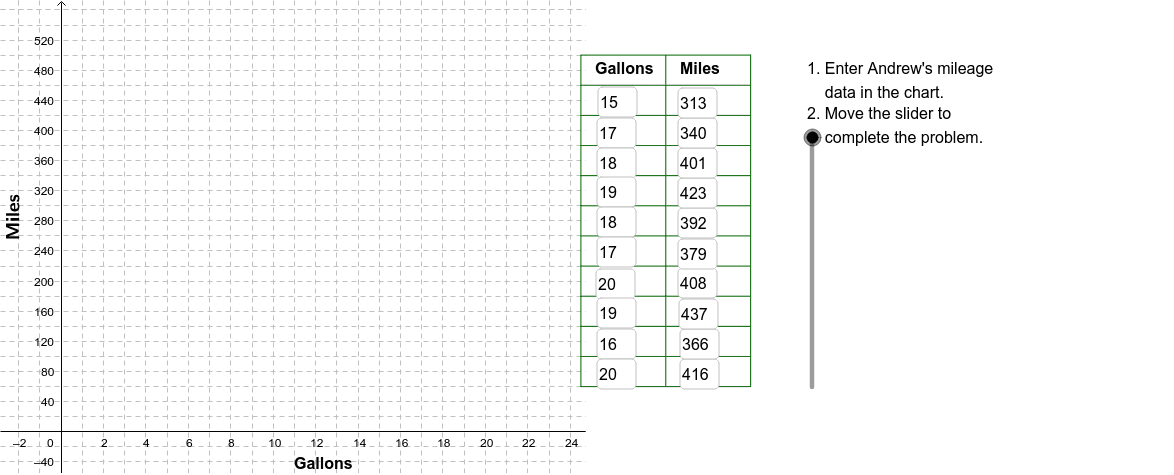
This example demonstrates how to use GeoGebra to calculate and visualize gas mileage (miles per gallon). Core math concepts include addition, means, functions, and complex numbers. Construction highlights involve commands like Corner, Polygon, Textfield, Sequence, Point, Line, VerticalText. Suitable for high school students learning data analysis and function modeling.
GeoGebra Commands & Parameters
Corner(2) → Corn2Corner(3) → Corn3Polygon(Corn1, Corn2, Corn3, Corn4) → poly1, corn1, corn2, corn3, corn4Textfield(A2) → InA2Textfield(A3) → InA3Textfield(A4) → InA4Textfield(A5) → InA5Textfield(A6) → InA6Textfield(A7) → InA7Textfield(A8) → InA8Textfield(A9) → InA9Textfield(A10) → InA10Textfield(A11) → InA11Textfield(B11) → InB11Textfield(B10) → InB10Textfield(B9) → InB9Textfield(B8) → InB8Textfield(B7) → InB7Textfield(B6) → InB6Textfield(B5) → InB5Textfield(B4) → InB4Textfield(B3) → InB3Textfield(B2) → InB2Sequence(Segment[(24.5, 60 + 40 * j), (32.5, 60 + 40 * j)], j, 0, 11) → LnListSequence(Segment[(24.5 + 4 * j, 60), (24.5 + 4 * j, 500)], j, 0, 2) → LnList2Point(a) → mpg10Line((0, 0), mpg10) → Lmpg10Line((0, 0), mpg22) → Lmpg22VerticalText("Miles") → LabelMiles
AI Drawing Prompt Reference
Draw a chart to represent car fuel efficiency, including a quadrilateral formed by four corner points and two line segments from the origin to represent different fuel efficiency scenarios. Add a vertical label to indicate miles. Input fields are used to input data, and a sequence of parallel line segments represents mile markers.
The prompt above was compiled from the original drawing commands and is for reference only.