
Geogebra Function Arts: Geometric and Statistical Integration
Loading the math board and drawing, please wait…
In collections
Function Arts
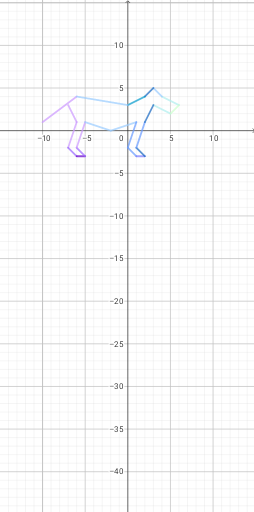
This example demonstrates the integration of geometric shapes and statistical data using Geogebra. Key mathematical concepts include the unit circle, parallelogram, median line, histogram, and logic. Construction involves objects like f, g, h, p, q, r, s, t and parameters f₁, g₁, h₁, etc., suitable for high school mathematics teaching or geometric statistical analysis.
GeoGebra Commands & Parameters
f(x) = If[-10 ≤ x ≤ -6, ((-(-0.75 / 1)) * x) + 8.5]g(x) = If[-7 ≤ x ≤ -6, (-2 * x) - 11]h(x) = If[-7 ≤ x ≤ -6, (3 * x) + 19]p(x) = If[-7 ≤ x ≤ -6, (-x) - 9]q(x) = If[-6 ≤ x ≤ -5, (0 * x) - 3]r(x) = If[-6 ≤ x ≤ -5, (-x) - 8]s(x) = If[-6 ≤ x ≤ -5, (3 * x) + 16]t(x) = If[-5 ≤ x ≤ -2, (-0.3333333333333333 * x) - 0.6666667]f_{1}(x) = If[-2 ≤ x ≤ 1, ((-(-0.3333333333333333 / 1)) * x) + 0.666666667]g_{1}(x) = If[0 ≤ x ≤ 1, (3 * x) - 2]h_{1}(x) = If[0 ≤ x ≤ 1, (-x) - 2]p_{1}(x) = If[1 ≤ x ≤ 2, (0 * x) - 3]q_{1}(x) = If[1 ≤ x ≤ 2, (-x) - 1]r_{1}(x) = If[1 ≤ x ≤ 2, (3 * x) - 5]s_{1}(x) = If[4 ≤ x ≤ 6, (-0.5 * x) + 6]t_{1}(x) = If[3 ≤ x ≤ 5, (-0.5 * x) + 4.5]f_{2}(x) = If[5 ≤ x ≤ 6, x - 3]g_{2}(x) = If[3 ≤ x ≤ 4, (-x) + 8]h_{2}(x) = If[2 ≤ x ≤ 3, x + 2]p_{2}(x) = If[0 ≤ x ≤ 2, ((-(-0.5 / 1)) * x) + 3 / 1]q_{2}(x) = If[-6 ≤ x ≤ 0, (-0.16666666666666666 / 1 * x) + 3 / 1]r_{2}(x) = If[2 ≤ x ≤ 3, ((-(-2 / 1)) * x) - 3 / 1]
AI Drawing Prompt Reference
Draw a composite figure made of multiple line segments that extend and connect across different x-intervals, forming several polygonal regions. Specifically include: an upward-sloping segment from x=-10 to -6, multiple slanted lines in the x=-7 to -6 range with slopes -2, 3, and -1 respectively, horizontal and slanted segments from x=-6 to -5, a descending slope from x=-5 to -2, upward lines from x=-2 to 1, several segments in x=0 to 1 and 1 to 2, slanted lines in x=2 to 3, descending slopes in x=3 to 5 and 4 to 6, and longer lines spanning x=0 to 2 and x=-6 to 0. The overall appearance presents a complex pattern of multiple geometric blocks, resembling a geometric statistical chart visual effect.
The prompt above was compiled from the original drawing commands and is for reference only.