
GeoGebra Function and Locus Construction Example
Loading the math board and drawing, please wait…
In collections
Realidades de GeoGebra
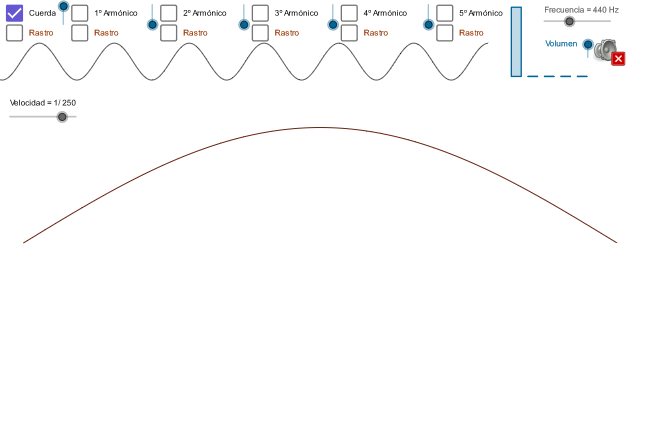
This example demonstrates constructing function graphs and loci using GeoGebra. Key mathematical concepts include function definition, parametric equations, geometric loci, and dynamic changes. Construction involves Function command, parameters A1-A5, locus point P, and slider animation verC. Suitable for high school students learning function graphs and geometric transformations, or for mathematical modeling teaching.
GeoGebra Commands & Parameters
Function((((A1 * k) * sin((pi * (x / 18 + 1 / 2)))) * sin((((2 * pi) * t) * v))), -9, 9) → a1Function(((((-A2) * k / 2) * sin(((2 * pi) * (x / 18 + 1)))) * sin((((4 * pi) * t) * v))), -9, 9) → a2Function((((A3^(2) * k / 6) * sin(((3 * pi) * (x / 18 + 3 / 2)))) * sin((((6 * pi) * t) * v))), -9, 9) → a3Function(((((-A4^(4)) * k / 24) * sin(((4 * pi) * (x / 18 + 2)))) * sin((((8 * pi) * t) * v))), -9, 9) → a4Function((((A5^(5) * k / 120) * sin(((5 * pi) * (x / 18 + 5 / 2)))) * sin((((10 * pi) * t) * v))), -9, 9) → a5Function(a1(x) + a2(x) + a3(x) + a4(x) + a5(x), -9, 9) → fFunction(a1(x) + a2(x) + a3(x) + a4(x) + a5(x), -9, 9) → fRFunction((((A1 * k) * sin((pi * (x / 18 + 1 / 2)))) * sin((((2 * pi) * t) * v))), -9, 9) → a1RFunction(((((-A2) * k / 2) * sin(((2 * pi) * (x / 18 + 1)))) * sin((((4 * pi) * t) * v))), -9, 9) → a2RFunction((((A3^(2) * k / 6) * sin(((3 * pi) * (x / 18 + 3 / 2)))) * sin((((6 * pi) * t) * v))), -9, 9) → a3RFunction(((((-A4^(4)) * k / 24) * sin(((4 * pi) * (x / 18 + 2)))) * sin((((8 * pi) * t) * v))), -9, 9) → a4RFunction((((A5^(5) * k / 120) * sin(((5 * pi) * (x / 18 + 5 / 2)))) * sin((((10 * pi) * t) * v))), -9, 9) → a5RFunction((b1(x) + b2(x) + b3(x) + b4(x) + b5(x)) / 2.5 + 5.5, -10, 5.1) → g1
AI Drawing Prompt Reference
Draw a composite function graph made up of five sine functions with different amplitudes, frequencies, and phases. First, draw each individual function, then sum them to get the final composite function. Adjust the amplitude using parameters A1 to A5, and modify the frequency and phase with parameters k, t, and v. Finally, draw a translated version of the composite function graph.
The prompt above was compiled from the original drawing commands and is for reference only.