
GeoGebra Exercise 1
Loading the math board and drawing, please wait…
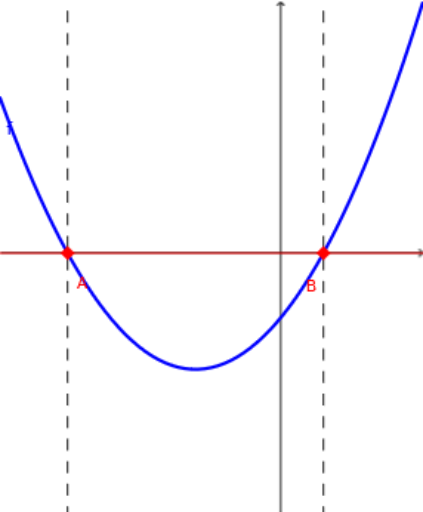
This example demonstrates interactive constructions involving equations, quadratic equations, linear functions, differential calculus, and line segments using GeoGebra. Key math concepts include equation solving, quadratic function graphs, linear function intersections, and integral calculations. Construction highlights involve commands like RandomElement, Random, Root, OrthogonalLine, Textfield, TableText, and objects such as a, b, c, d, f, A, B, g, h, e, i. Suitable for high school and above students to visualize functions, equations, and calculus concepts.
GeoGebra Commands & Parameters
RandomElement({-5, -4, -3, -2, -1, 1, 2, 3, 4, 5}) → aRandom(-10, 10) → bRandomElement({-5, -4, -3, -2, -1, 1, 2, 3, 4, 5}) → cRandom(-10, 10) → dRoot(f) → A, BOrthogonalLine(A, xAxis) → gOrthogonalLine(B, xAxis) → hTextfield(m) → InputBox1TableText({{A1, B1}, {-3, f(-3)}, {-2, f(-2)}, {-1, f(-1)}, {0, f(0)}, {1, f(1)}, {2, f(2)}, {3, f(3)}}, "|_r") → text3
AI Drawing Prompt Reference
Create an interactive graph showing quadratic and linear functions, highlighting equation solving, function graphs, intersections, and integral calculations. Randomly generate parameters a and b for a quadratic function, and c and d for a linear function. Find the roots of the quadratic, draw perpendicular lines through them, label key points, display function values, input the slope in a text field, and show changes in function values in a table.
The prompt above was compiled from the original drawing commands and is for reference only.