
GeoGebra Example: Visualizing Triangles and Pythagorean Theorem
Loading the math board and drawing, please wait…
In collections
Mapping Diagrams: From AB to C&DE, Resource
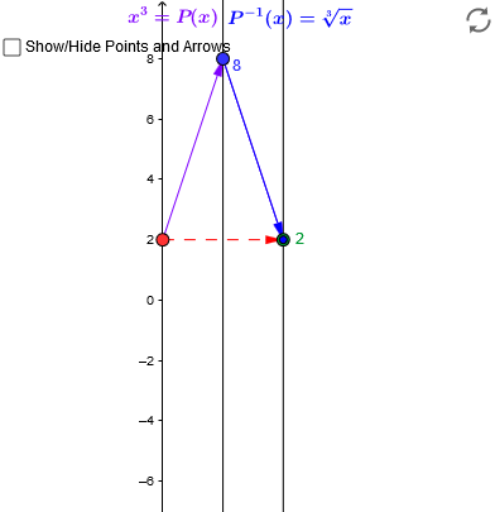
This example dynamically demonstrates the geometric relationship between triangles and the Pythagorean theorem. Key math concepts include the Pythagorean theorem, vectors, sequences, and coordinate geometry. Construction highlights involve commands like Point, Vector, Textfield, and Sequence to create points, vectors, texts, and sequences for geometric visualization. Suitable for high school mathematics teaching to help students intuitively understand the Pythagorean theorem and its applications.
GeoGebra Commands & Parameters
Point(yAxis) → XVector(X, B) → fVector(B, C) → gTextfield(f_2) → inputBox1Textfield(g_2) → inputBox2Vector(B, D) → vVector(X, C) → uSequence((i, g_2(i)), i, -8, 8) → list1Sequence(Vector[(2, i), (4, g_2(i))], i, -8, 8) → list2_2
AI Drawing Prompt Reference
Draw a right triangle to visualize the relationship between its sides and vectors, with dynamic text boxes labeling the lengths of two vectors, and plot sequence points on the coordinate axes to demonstrate the Pythagorean theorem. Start by constructing the triangle's three vertices and hypotenuse, then draw two vectors from the right-angled vertex, label their lengths, and finally plot sequence points on the axes based on these lengths to show the dynamic geometric relationships.
The prompt above was compiled from the original drawing commands and is for reference only.