
Geogebra Example: Geometry & Statistics Demonstration
Loading the math board and drawing, please wait…
In collections
Mapping Diagrams: From AB to C&DE, Resource
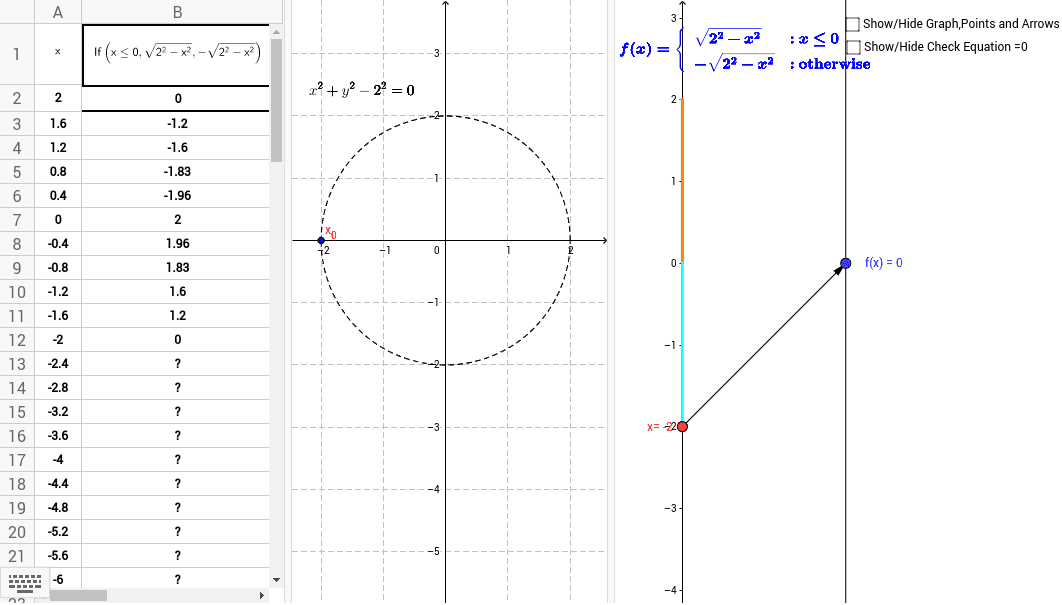
This example dynamically demonstrates geometric and statistical concepts including perimeter, arithmetic mean, congruence, percentages, and statistics through interactive graphics. Key math concepts involved are perimeter calculation, arithmetic mean, congruence determination, percentage change, and statistical data analysis. Construction highlights include using GeoGebra commands/objects like points (r, g, f_3), segments (A-B), text fields, implicit curves, and sequences. Suitable for high school mathematics education to illustrate geometric transformations and statistical applications.
GeoGebra Commands & Parameters
Point(yAxis) → A_1Vector(A_1, B) → uSegment((0, a_2), (0, 5)) → eTextfield(f_1) → inputBox1Textfield(f_2) → inputBox2Textfield(f_3) → inputBox3ImplicitCurve(g(x, y)) → hVector(B, E) → vSegment((0, a_1), (0, Min[r, a_2])) → dSegment((0, (-r)), (0, Min[r, a_1])) → cSequence(Vector[(0, k), (2, f(k))], k, (-r), r, r / n) → list1Sequence((k, f(k)), k, (-r), r, r / n) → list2Textfield(g) → inputBox4