
GeoGebra Demo: Correlation, Area, Normal Distribution, Derivative
Loading the math board and drawing, please wait…
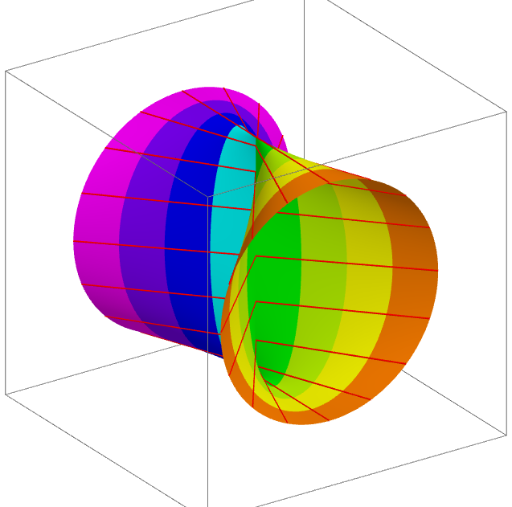
This example demonstrates correlation, area calculation, normal distribution curves, and their derivatives through dynamic GeoGebra graphics. It involves core math concepts like correlation analysis, integral areas, normal distribution properties, derivative geometric interpretations, and statistical methods. Constructed using commands Surface and Sequence, with objects r, a, l, n, s1-s8, it visualizes parametric surfaces and dynamic data. Suitable for high school and above in probability statistics and calculus education.
GeoGebra Commands & Parameters
Surface(u, ((r / l * u) * cos(v)), (r * sin(v)), u, (-l), (-3 / 4 * l), v, 0, a) → s1Surface(u, ((r / l * u) * cos(v)), (r * sin(v)), u, (-3 / 4 * l), (-1 / 2 * l), v, 0, a) → s2Surface(u, ((r / l * u) * cos(v)), (r * sin(v)), u, ((-l)) / 2, ((-l)) / 4, v, 0, a) → s3Surface(u, ((r / l * u) * cos(v)), (r * sin(v)), u, ((-l)) / 4, 0, v, 0, a) → s4Surface(u, ((r / l * u) * cos(v)), (r * sin(v)), u, 0, l / 4, v, 0, a) → s5Surface(u, ((r / l * u) * cos(v)), (r * sin(v)), u, l / 4, l / 2, v, 0, a) → s6Surface(u, ((r / l * u) * cos(v)), (r * sin(v)), u, (l * 3 / 4), l, v, 0, a) → s8Surface(u, ((r / l * u) * cos(v)), (r * sin(v)), u, l / 2, (3 * l / 4), v, 0, a) → s7Sequence(CurveCartesian[u, ((r / l * u) * cos(v)), (r * sin(v)), u, (-l), l], v, 0, a, (2 * π / n)) → liste1
AI Drawing Prompt Reference
Create a dynamic visualization demonstrating correlation with multiple parametric surfaces that form a continuous geometric structure, representing a rotating body. The surfaces are generated across varying ranges of parameters u and v, illustrating the geometric interpretation of integral areas, normal distribution curves, and their derivatives, suitable for high school probability, statistics, and calculus education.
The prompt above was compiled from the original drawing commands and is for reference only.