
GeoGebra Activity: Positive/Negative Gains, Slope, and Continuity
Loading the math board and drawing, please wait…
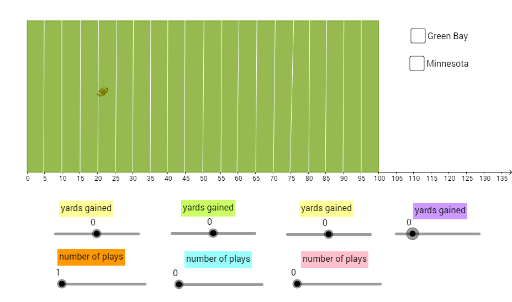
This GeoGebra activity demonstrates positive and negative gains through a dynamic visual setup, using points, segments, rays, and a polygon to represent changes in direction, magnitude, and interval. It connects integer operations, division, exponents, difference and slope, logarithmic functions, and continuity, helping students interpret how positive and negative quantities appear in graphs and geometric constructions. The construction uses Point objects to define key locations, Segment and Ray objects to show bounded and unbounded directions, Polygon to create a closed region or diagram, and text/gain objects to label variables and explanations, with pic1 supporting the activity context. It is suitable for middle-school to high-school mathematics, introductory function and coordinate-geometry lessons, and classroom exploration of slope, continuity, and signed quantities.
GeoGebra Commands & Parameters
Polygon(D, B, A, C) → poly1, d, b, a, cSegment(E, F) → fPoint(b) → IRay(I, J) → mPoint(b) → KRay(K, L) → nPoint(b) → MRay(M, N) → pPoint(b) → ORay(O, P) → qPoint(b) → QRay(Q, R) → rPoint(b) → SRay(S, T) → sPoint(b) → URay(U, V) → tPoint(b) → WRay(W, Z) → f_1Point(b) → C_1Ray(C_1, D_1) → h_1Point(b) → A_1Ray(A_1, B_1) → g_1Point(b) → E_1Ray(E_1, F_1) → i_1Point(b) → G_1Ray(G_1, H_1) → j_1Point(b) → I_1Ray(I_1, J_1) → k_1Point(b) → K_1Ray(K_1, L_1) → l_1Point(b) → M_1Ray(M_1, N_1) → m_1Point(b) → O_1Ray(O_1, P_1) → n_1Point(b) → Q_1Ray(Q_1, R_1) → p_1Point(b) → S_1Ray(S_1, T_1) → q_1Point(b) → U_1Ray(U_1, V_1) → r_1
AI Drawing Prompt Reference
Draw a polygon with points defining key locations, extend multiple rays from one vertex of the polygon to show different directions, and label variables and explanations with text to illustrate concepts of positive/negative gains, slope, and continuity.
The prompt above was compiled from the original drawing commands and is for reference only.