
Functions and Derivatives
Loading the math board and drawing, please wait…
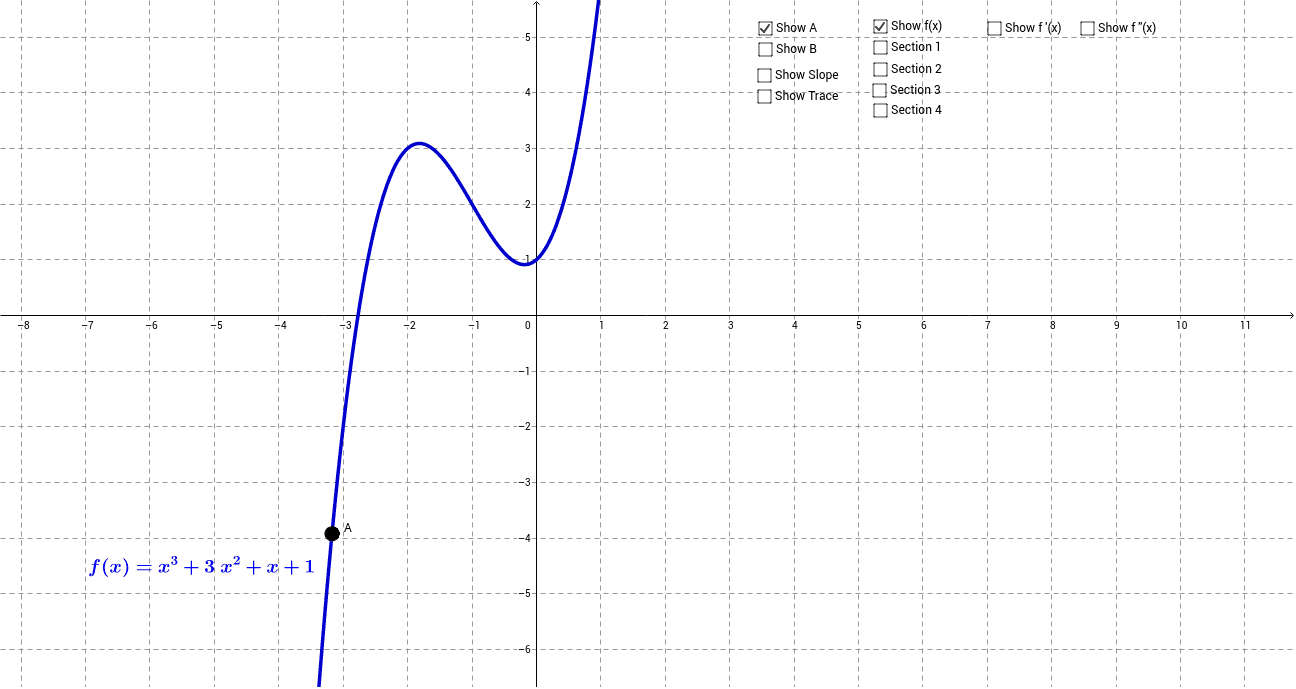
This example demonstrates how students can discover the local maximum and minimum points of a function by investigating the relationship between the function graph and its derivative. Key math concepts include functions, derivatives, tangent slopes, and limits. Constructed using GeoGebra commands like Function, Point, Tangent, Slope, Derivative, and Segment. Suitable for high school and above students learning calculus to understand the application of derivatives in function analysis.
GeoGebra Commands & Parameters
Function(x^(3) + (3 * x^(2)) + x + 1, -4, 4) → fPoint(f) → ATangent(A, f) → aSlope(a) → mDerivative(f) → f'Tangent(E, f') → bFunction(x^(3) + (3 * x^(2)) + x + 1, -4, -1.82) → hFunction(x^(3) + (3 * x^(2)) + x + 1, -1.82, -1) → pFunction(x^(3) + (3 * x^(2)) + x + 1, -1, -0.19) → qFunction(x^(3) + (3 * x^(2)) + x + 1, -0.19, 4) → rPoint(a) → FPoint(a) → DSegment(D, F) → lDerivative(f') → f''Point(f') → BTangent(B, f') → tPoint(t) → HPoint(t) → GSegment(G, H) → a_1Slope(a_1) → m_2
AI Drawing Prompt Reference
Draw a function graph and its derivative. Mark the local maximum and minimum points on the function graph, and draw the tangent lines at these points to show their slopes. Also, plot the derivative graph and mark its zeros, which correspond to the extrema of the function. Finally, connect the extrema on the function graph to their corresponding zeros on the derivative graph to observe the relationship between them.
The prompt above was compiled from the original drawing commands and is for reference only.