
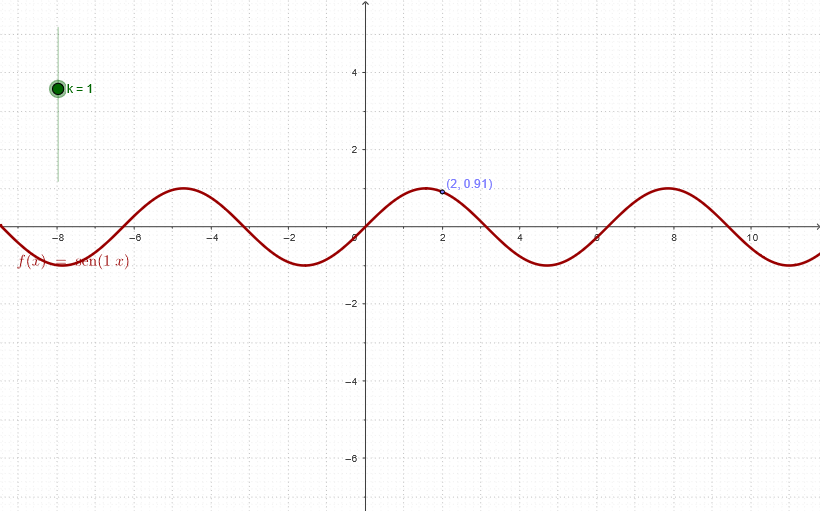
Function Transformation f(k·x) Example
Loading the math board and drawing, please wait…
In collections
geometriadinamica.es
This example demonstrates how the function graph transforms under scaling with coefficient k. Key math concepts include function transformation, linear scaling, and graphical change patterns. Construction highlights use of GeoGebra commands like Point and Segment for key points T1, T3, T4, defining variable k, function f, and points A, B, C, e, a. Suitable for high school mathematics teaching to understand function transformation properties.
GeoGebra Commands & Parameters
Point(f) → ASegment(C, A) → eSegment(A, B) → a
AI Drawing Prompt Reference
Draw the graph of a function f(x) and observe its transformation by changing the coefficient k. First, find a point A on the graph of f(x), then draw a line segment e from point C to A, and another line segment a from A to B.
The prompt above was compiled from the original drawing commands and is for reference only.