
Function Graphing Activity
Loading the math board and drawing, please wait…
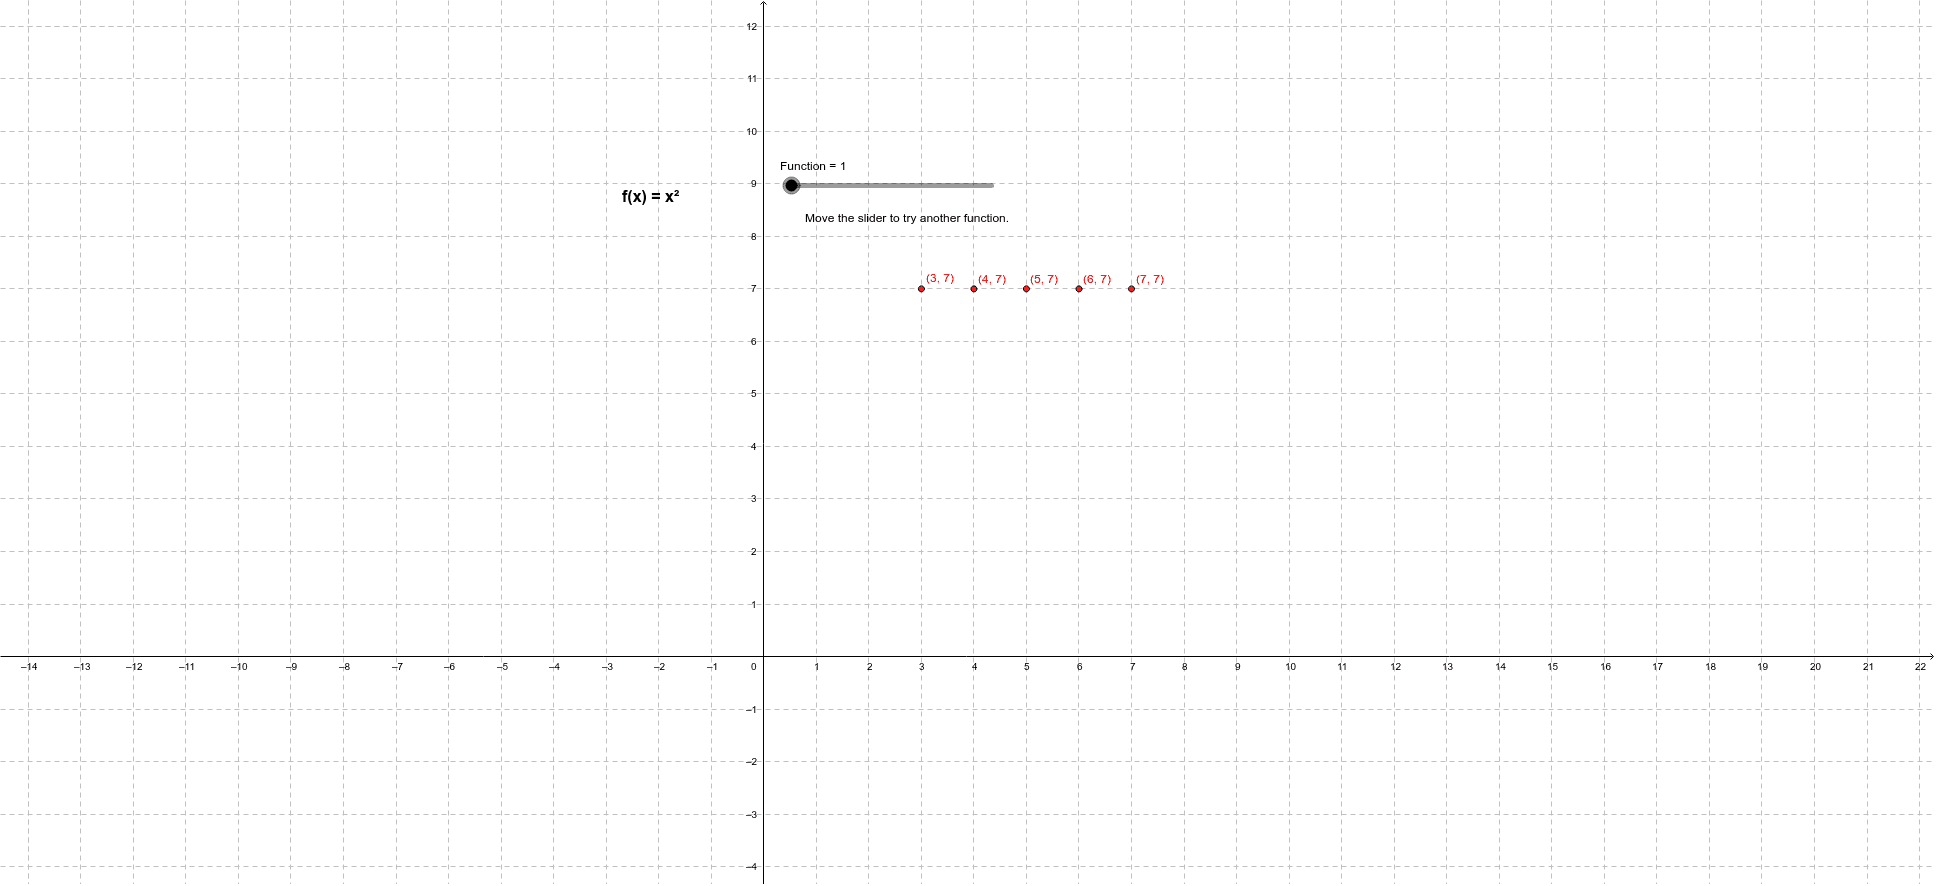
This example demonstrates how students can plot points to create multiple function graphs, which appear once all 5 points are plotted. It involves core math concepts like function graphing, sine function, differential calculus, ellipse, division, and multiplication. The construction uses GeoGebra commands such as Intersect and Point, along with objects like f, A, B, C, D, E, g, m, n, and Function. It is suitable for high school students learning function graphing, understanding function properties, and applying GeoGebra for mathematical exploration.
GeoGebra Commands & Parameters
Intersect(f, xAxis, 1) → APoint(f) → BPoint(f) → CPoint(f) → D
AI Drawing Prompt Reference
Draw a function graph and show its intersection with the x-axis, then mark five points on the function graph in sequence, illustrating the relationship between the points and the intersection, showcasing the function graph, intersection points, and the distribution of the points.
The prompt above was compiled from the original drawing commands and is for reference only.