
Function Addition and Differential Quotient Illustration
Loading the math board and drawing, please wait…
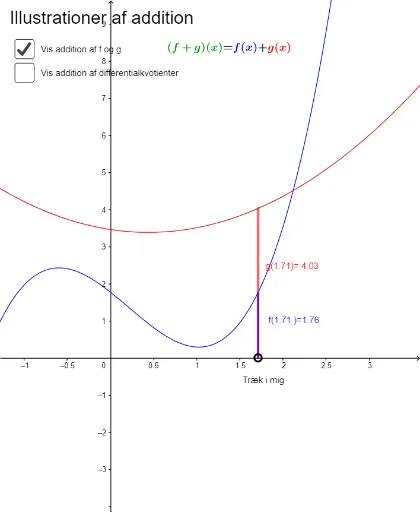
This example demonstrates the graphical representation of the addition of two functions and their differential quotients. Key math concepts include function graphs, differential quotients, tangent slopes, and integrals. It utilizes GeoGebra commands/objects like Point, OrthogonalLine, Intersect, Distance, Segment, Integral, IntegralBetween, Tangent, Slope, and Polygon as outlined in the construction summary. Suitable for high school and above students to understand fundamental principles of function operations and calculus.
GeoGebra Commands & Parameters
Point(xAxis) → AOrthogonalLine(A, xAxis) → aIntersect(f, a, 1) → BIntersect(g, a, 1) → CDistance(C, A) → afstandCADistance(B, A) → afstandBASegment(A, C) → bOrthogonalLine(A1, xAxis) → cIntersect(h, c, 1) → DDistance(A1, D) → afstandA1DSegment(D, A1) → dSegment(B, A) → eSegment(A1, B2) → iPoint(xAxis) → EPoint(xAxis) → FIntegral(f, x(E), x(F)) → lIntegral(g, x(E), x(F)) → mIntegral(h, x(E), x(F)) → nIntegral(k1, x(E), x(F)) → oIntegralBetween(h, k1, x(E), x(F)) → pSegment(B2, D) → rPoint(xAxis) → GTangent(x(G), g) → sTangent(x(G), f) → tSlope(s) → a_1Slope(t) → a_2Tangent(x(G), h) → b_1Segment(H, I) → c_1Segment(I, K) → d_1Segment(K, J) → e_1Polygon(H, I, J) → polygon1, j_1, h_1, i_1
AI Drawing Prompt Reference
Draw the graphs of two functions and their sum. Show the tangent lines at the points where each function intersects the x-axis, and calculate their slopes. Connect the points of tangency to the origin with line segments and label the slopes. Take two points on the x-axis, and illustrate the integral areas of both functions and their sum between these points. Finally, draw a triangle connecting the tangent points, the origin, and another tangent point.
The prompt above was compiled from the original drawing commands and is for reference only.